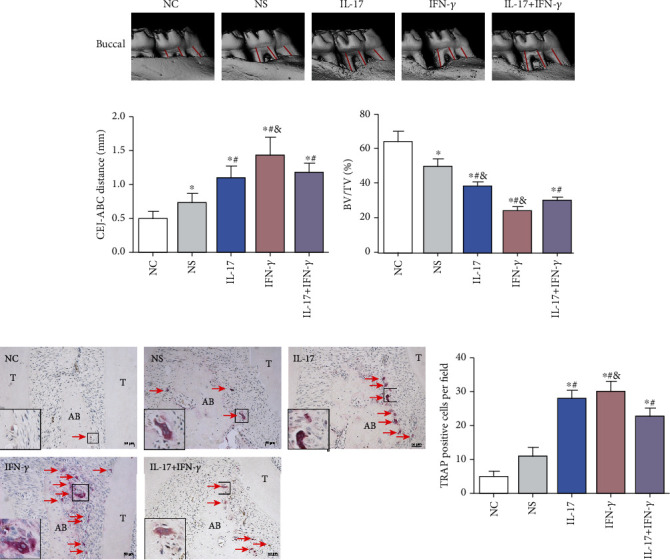
Figure 5.

Effect of IL-17 (5 μg/ml) or/and IFN-γ (1 μg/ml) on alveolar bone loss and osteoclast differentiation. (a) Reconstructed micro-CT images showed the buccal view of the first maxillary molars. The distance from CEJ to ABC indicated bone loss, shown by the red lines. Quantitative analysis results of the (b) CEJ-ABC distance and (c) BV/TV are shown as mean ± standard deviation. (d) TRAP staining was used to evaluate the formation of osteoclasts (red arrows) for the NC, NS, IL-17, IFN-γ, and IL-17+IFN-γ groups (scale bar = 50 μm). (e) Quantitative analysis was performed on the number of TRAP-positive multinucleated cells in the interradicular regions of the first maxillary molars (mean ± standard deviation, n = 5). ∗p < 0.05 compared with the NC group, #p < 0.05 compared with the NS group, and &p < 0.05 compared with the IL-17+IFN-γ group. ABC: alveolar bone crest; CEJ: cemento-enamel junction; BV: bone volume; TV: tissue volume; T: tooth; AB: alveolar bone.
