
Figure. 2.
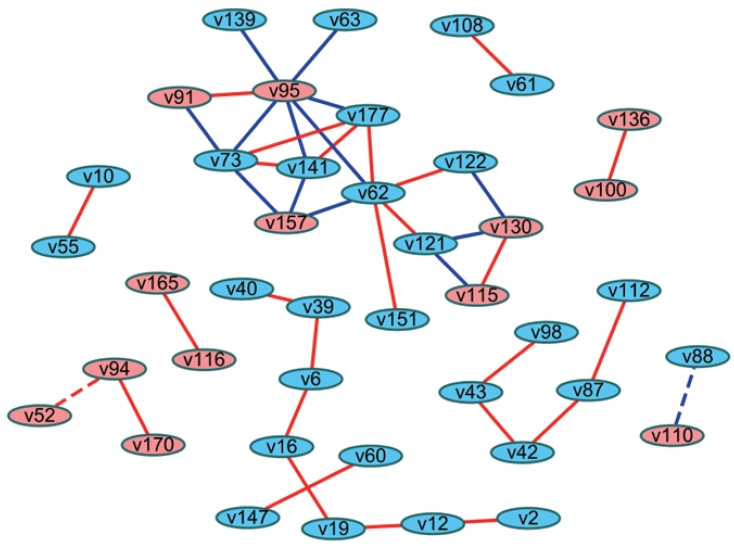
Example of a differential correlation network between hypothetical condition A (Figure 1A) and hypothetical condition B (Figure 1B) from artificial data. Linked edges denote significantly different correlation coefficients between hypothetical condition A and hypothetical condition B. Red nodes: positive associations with the virtual outcome variable, blue nodes: negative associations with the virtual outcome variable, red edges: positive correlations, blue edges: negative correlations, solid edges: higher correlation coefficients in hypothetical condition A, dotted edges: higher correlation coefficients in hypothetical condition B.