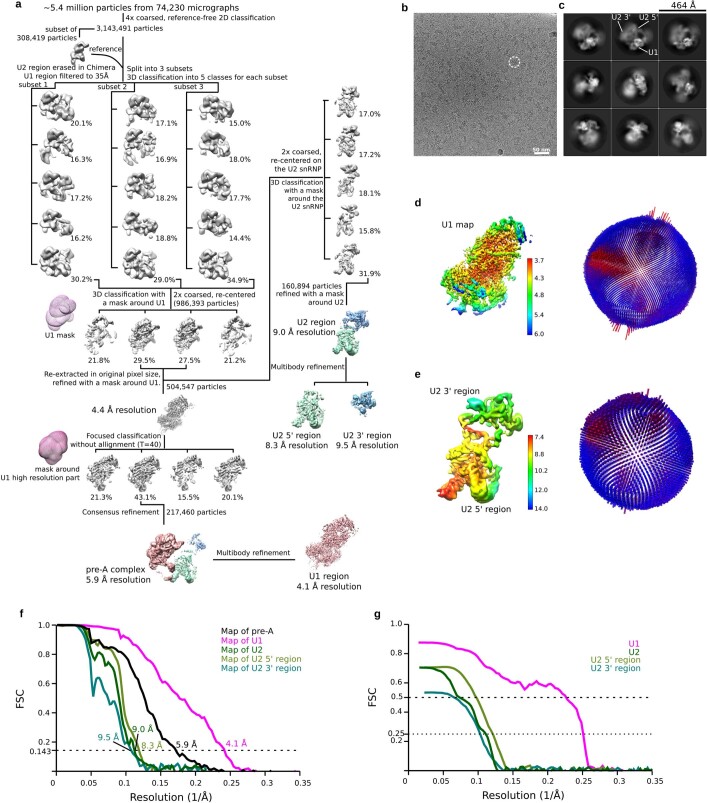
Extended Data Fig. 2. Cryo-EM and image processing for the ΔBS-A pre-A complex.
a, Computation sorting scheme. All major image-processing steps are depicted. For a more detailed explanation, see the Methods section on ‘Image processing’. b, Typical cryo-EM micrograph (out of a total of 74,230) of the S. cerevisiae pre-A complex recorded at ×120,700 magnification with a Titan Krios microscope using a Falcon III direct electron detector operating in integration mode at a calibrated pixel size of 1.16 Å. c, Representative cryo-EM 2D class averages of the yeast pre-A complex reveal considerable flexibility between the U1 snRNP and the U2 snRNP. d, Left, local-resolution estimations of the cryo-EM reconstruction of the U1 snRNP. Right, plot showing the distribution of orientations for the particles contributing to the U1 reconstruction. e, Left, local-resolution estimations of the cryo-EM reconstructions of the U2 5′- and 3′-regions. Right, plot showing the distribution of orientations for the particles contributing to the reconstructions of the U2 5′- and 3′-regions. f, A Fourier shell correlation (FSC), calculated using the ‘post-processing’ routine in RELION, indicates a global resolution of 5.9 Å for the entire yeast pre-A complex and of 4.1 Å, 8.3 Å and 9.5 Å for the multibody-refined U1, U2 5′- and U2 3′-regions, respectively. The resolution was limited to 5.9 Å on average, owing to the movement of the U1 and U2 snRNPs relative to each other. Signal subtraction combined with local refinement improved the more stable U1 snRNP part to 4.1 Å resolution, whereas the bipartite U2 snRNP exhibited considerable internal flexibility and was refined only to 9 Å resolution. As the U2 5′-region—which is composed of the SF3b proteins, U2 SLIIa/b and the U2–BS helix—is attached to the more stable U1 snRNP and is therefore less flexible, further local classification and refinement improved the resolution of the U2 5′-region to 8.3 Å. The U2 3′-region—which comprises the U2 Sm core, U2 SLII, and Lea1 and U2-B′′ bound to U2 SLIV, plus the adjacent SF3a core (that is, regions of Prp9, Prp11 and Prp21 whose crystal structure has been determined previously44)—does not contact the U1 snRNP and therefore exhibits the greatest flexibility relative to the rest of the complex. g, Map versus model FSC curves for the U1, U2, U2 5′- and U2 3′-regions, using PHENIX mtriage45.

