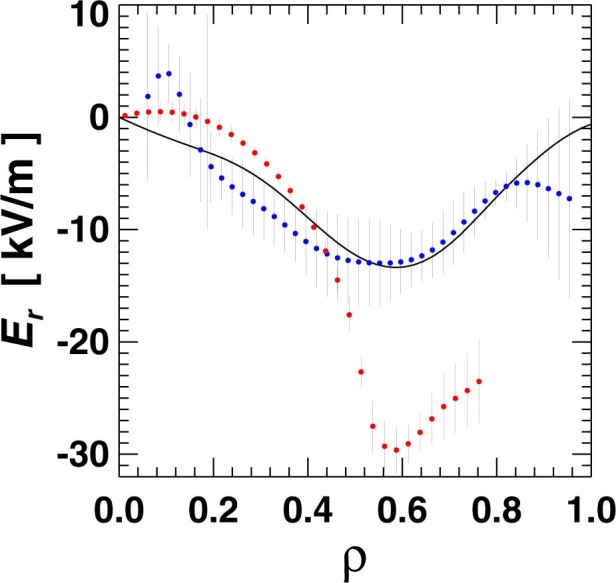
Extended Data Fig. 3. Profiles of the radial electric field as a function of the normalized plasma radius.

Experimental results from CXRS (blue) and XICS (red) measurements are compared to the theoretical expectations from the ambipolarity constraint (black) for the plasma profiles of Fig. 2. Error bars depict one standard deviation in the evaluation of the measurements. The XICS analysis is described in ref. 30; documentation of the methodology used to evaluate the CXRS measurements is in preparation.
