
FIGURE 1.
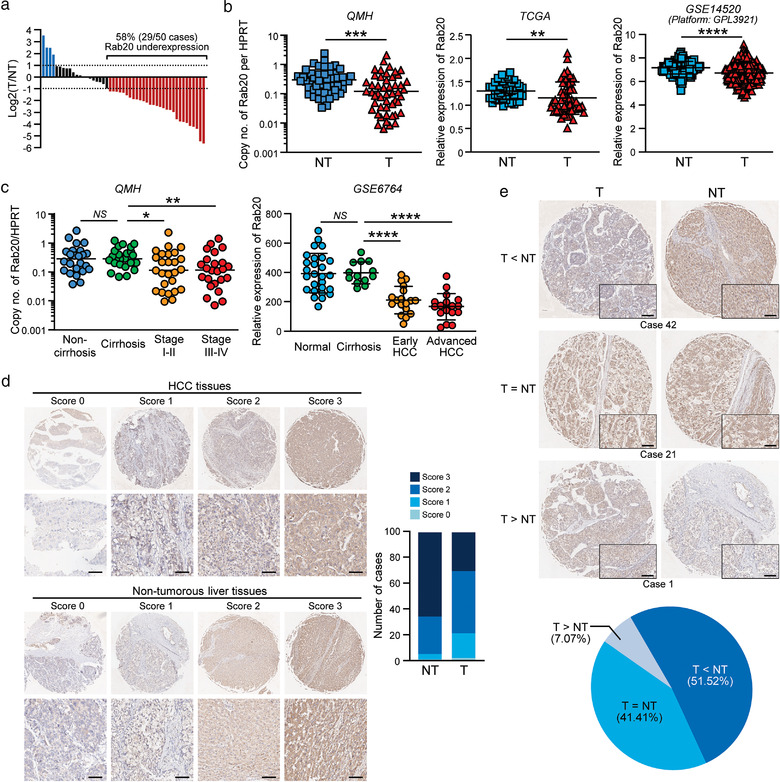
Rab20 is frequently downregulated in HCC clinical samples. (a) The waterfall plot shows the fold change of Rab20 expressions in 50 pairs of HCC and adjacent non‐tumorous tissues in log scale. (b) Expressions of Rab20 in HCC and non‐tumorous liver tissue were compared in cohorts from Queen Mary Hospital (QMH) (left), TCGA (middle) and GSE14520 (platform: GPL3921) (right) databases of liver cancer. (c) Dot plots showing expression of Rab20 in samples from QMH (left) and GSE6764 (right) database in a stage‐dependent manner during HCC development. (d) Immunohistochemical staining of Rab20 in TMA. Representative images of Rab20 expression in HCC and non‐tumorous liver tissues with high (scores 2 to 3) and low (0 to 1) scores. Scale bar: 50 μm. The bar chart showing number of cases based on scoring intensity. A total of 99 cases of paired HCC and non‐tumorous tissues were stained. (e) Representative cases showing overexpression (case 42), no change (case 21) and underexpression (case 1) of Rab20. The pie chart reveals Rab20 underexpression in about half of the cases. Data are represented as mean. *P < 0.05, **P < 0.01, ***P < 0.001, ****P < 0.0001. P < 0.05 is considered as statistically significant. NS, not significant