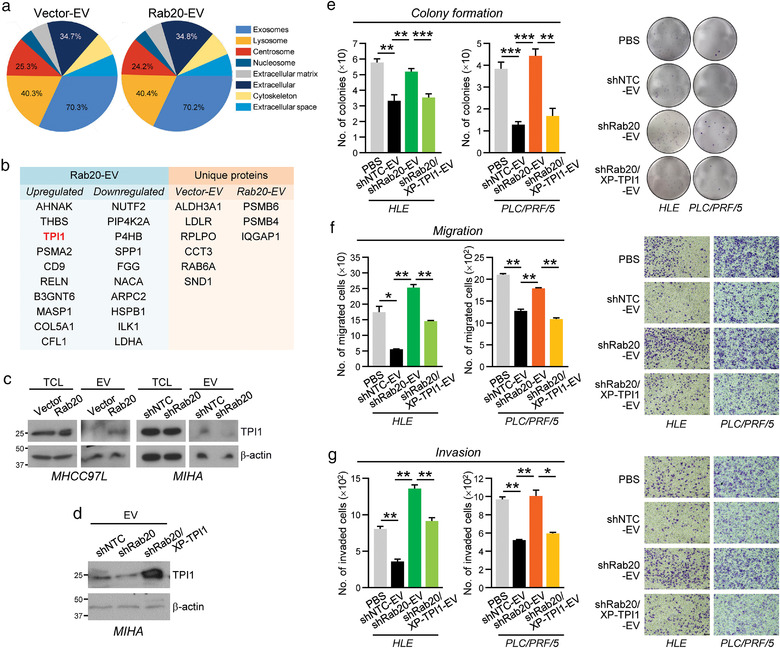
FIGURE 4.

Identification of TPI1 in EV regulated by intracellular Rab20 expression. (a) Proteins isolated from EVs derived from MHCC97L Vector‐ and Rab20‐EV were analysed by mass spectrometry. Cellular distribution of the identified proteins was analysed by FunRich 3.1.3, and displayed in the pie chart. (b) Rab20‐EV proteins with a fold change of at least 2‐fold when compared to Vector‐EV was regarded as upregulated or downregulated. The top 10 significantly modulated proteins in Rab20‐EV when compared to Vector‐EV (Left), and uniquely expressed proteins in Vector‐ and Rab20‐EV (Right) are shown. (c) Expression of TPI1 was probed with anti‐TPI1 antibody in the total cell lysates (TCL) and EVs of MHCC97L Vector and Rab20 cells (left), as well as MIHA shNTC and shRab20 cells (right). β‐actin was used to normalize the loading of protein samples. (d) Immunoblot image showing the expression of TPI1 in MIHA shCTL‐, shRab20‐, and shRab20/XPack‐TPI1‐EV. HLE and PLC/PRF/5 cells treated with indicated EVs were subjected to colony formation (e), migration (f) and invasion (g) assays. At the end of incubation, colonies, migrated and invaded cells were fixed, stained and counted. Representative images of cells and colonies were displayed. Data are represented as mean ± SEM. *P < 0.05, **P < 0.01, ***P < 0.001. P < 0.05 is considered as statistically significant
