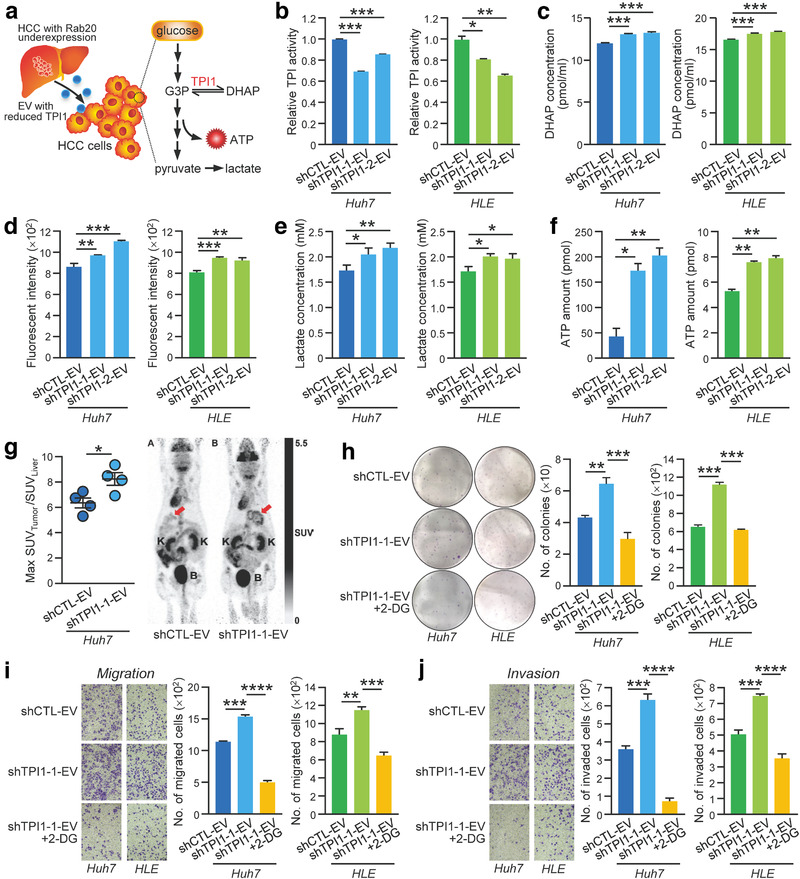
FIGURE 6.

EVs with reduced TPI1 promoted aerobic glycolysis leading to enhanced growth and motility in treated cells. (a) Schematic diagram illustrating the proposed altered pathway in the recipient cells after treating with EVs with reduced TPI1. (b) After treating Huh7 and HLE cells with PLC/PRF/5 shCTL‐, shTPI1‐1 and shTPI1‐2‐EVs, TPI activity in EV‐treated cells was determined by the TPI Activity Assay. Huh7 and HLE cells treated with the indicated EVs were assayed for DHAP level (c), glucose uptake activity (d), lactate production (e) and ATP level (f). (g) Huh7 cells treated with shCTL‐ and shTPI1‐1‐EVs were orthotopically injected into the liver of nude mice (n = 4). Four weeks after the injection, 18F‐deoxyglucose was intravenously injected into the mice through tail vein, and the mice were subjected to micro‐PET scan to observe glucose uptake level in the liver tumour. Representative images of PET scan were displayed. The red arrow indicates the area of 18F‐FDG uptake in the liver. K, Kidney; B, Bladder. Huh7 and HLE cells treated with PLC/PRF/5 shCTL‐ and shTPI1‐1‐EVs in the absence and presence of 5 mM 2‐deoxyglucose (2‐DG) were subjected to colony formation (h), migration (i) and invasion (j) assays. Data are represented as mean ± SEM. *P < 0.05, **P < 0.01, ***P < 0.001, ****P < 0.0001. P < 0.05 is considered as statistically significant
