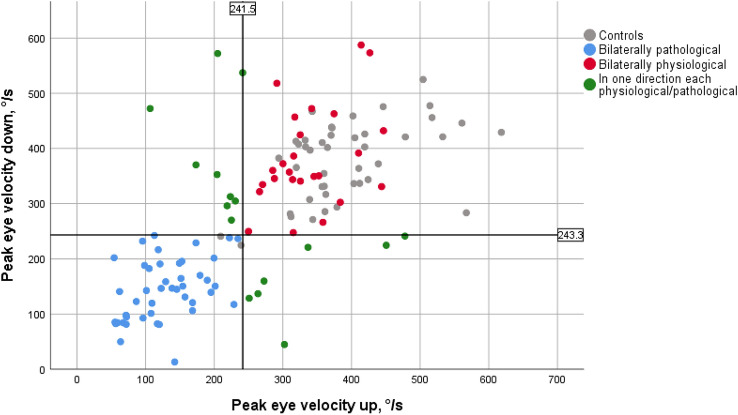
Fig. 1.
Peak eye velocities upward and downward. The values achieved by the control group (grey dots) are in the upper range of the patients’ results in both directions. The blue dots correspond to patients with pathological values in both directions. The patients with non-pathological values in both directions are shown as red dots, those in whom only one direction was considered to be pathological are shown as green dots. In the upward saccades, the patients reached only lower velocities than the controls, while the downwards velocities were higher in four patients. The black solid lines delineate the limits for upward and downward movement

