Fig. 3.
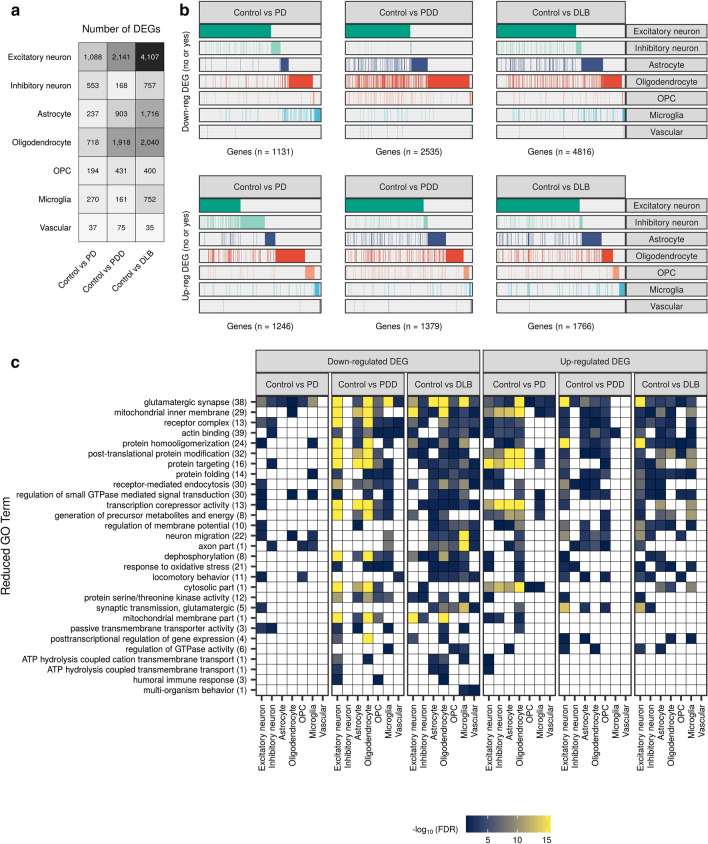
Cell-type-specific gene expression changes and pathway enrichments across disease states. a Number of differentially expressed (DE) genes across each cell type in pairwise comparisons of disease groups to the control group (|log2(fold change)|> log2(1.5), FDR < 0.05). The intensity of the grey colour is proportional to the number of DE genes. b Binary plot indicating with bars whether a gene (column) is down-regulated (upper panel) or up-regulated (lower panel) in a given cell type (rows). Number of DE genes in each comparison indicated on the x-axis. c Reduced gene ontology (GO) terms associated with cell-type-specific down- and up-regulated DE genes identified across pairwise comparisons of disease groups with the control group. Due to the magnitude of pathway enrichments, original GO term enrichments (referred to as “child terms”) were grouped using semantic similarity. The number of enriched child GO terms assigned to each reduced parent term across all cell types and comparisons in the panel is indicated in parentheses on the y-axis. Reduced GO terms were ordered on the y-axis by the number of cell types and comparisons in which the term was found enriched. The fill of each tile indicates the − log10(FDR) of the most significant child term associated with the parent term within that comparison/cell type. Non-significant results (FDR > 0.05) were coloured white. Results for pairwise comparisons between disease groups are displayed in Supplementary Fig. 7. All cell-type-specific DE genes and pathway enrichments are available in Supplementary Table 5 and Supplementary Table 6, respectively. DEG differentially expressed gene, OPC oligodendrocyte precursor cell

