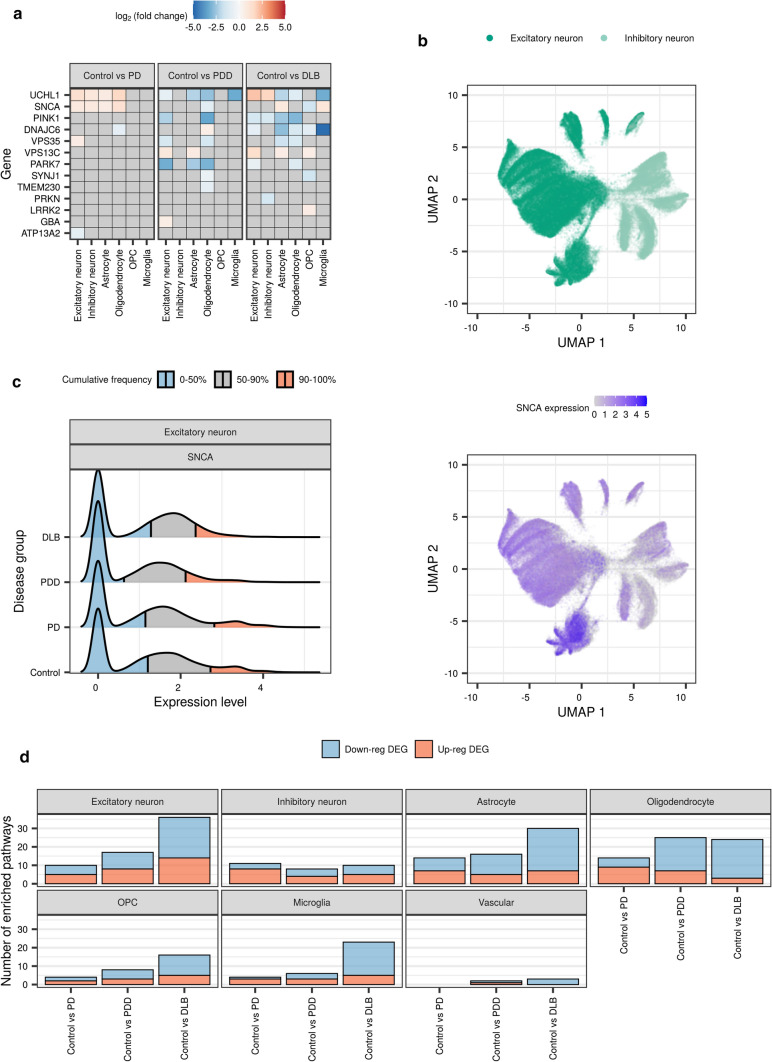
Fig. 4.
Cell-type-specific alterations of PD-associated genes and pathways. a Differential expression of PD-associated genes (associated by mutations reported to cause PD) across cell types and pairwise comparisons of disease groups with the control group. Fill of the tile indicates the log2(fold change), with non-significant results (FDR > 0.05) coloured grey. b UMAP plot of excitatory and inhibitory neurons (upper panel, 102,293 nuclei), with SNCA expression levels (lower panel). c Ridgeline plot of distribution of SNCA expression levels in excitatory neurons across disease groups. Distributions have been split into 3 cumulative quantiles, highlighting, where 0–50%, 50–90% and 90–100% of the nuclei in each disease group lie. d Number of enriched pathways (FDR < 0.05) identified using cell-type-specific down- and up-regulated DE genes from each pairwise comparison together with 46 PD-associated pathways (associated in a large-scale polygenic risk score-based assessment of 2199 gene sets). DEG differentially expressed gene, GO gene ontology, OPC oligodendrocyte precursor cell, UMAP uniform manifold approximation and projection. PD-associated genes and pathways were derived from references [12, 16], respectively

