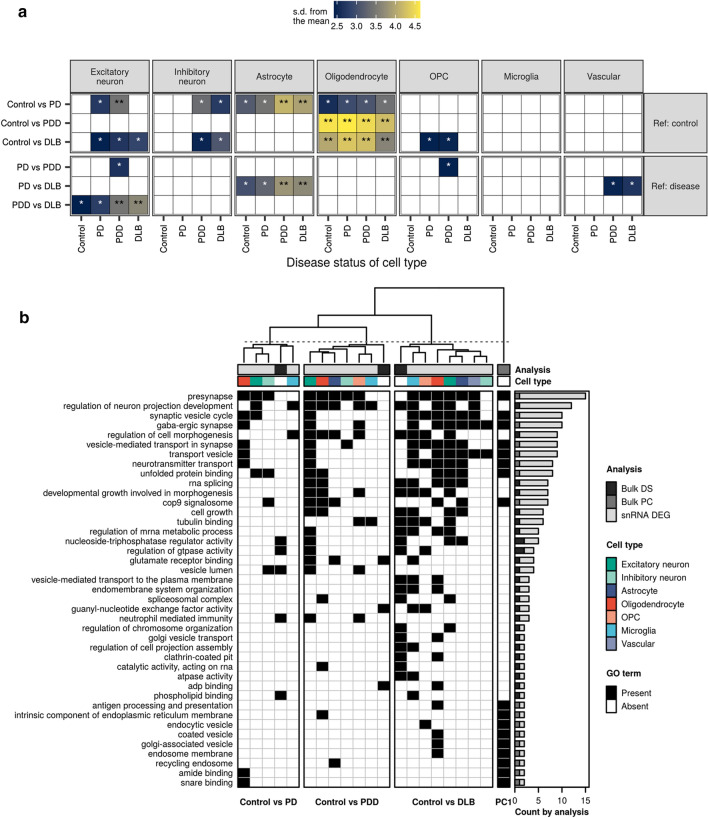
Fig. 6.
Cell-type enrichments of differentially spliced genes and pathway sharing across analyses. a Enrichment of the top 100 differentially spliced genes (FDR < 0.05, |∆PSI| ≥ 0.1, with rank determined by |∆PSI|) in cell types derived from each disease group. Enrichments were determined using expression-weighted cell-type enrichment (EWCE). The x-axis denotes the disease status of the cell type in question, while the y-axis denotes the groups compared in the differential splicing analysis. Pairwise comparisons have been grouped by whether diseased individuals are compared with control individuals (Ref: control) or other diseased individuals (Ref: disease). Tiles were coloured by standard deviations (s.d.) from the mean, which indicate the distance (in s.d.) of the target list from the mean of the bootstrapped samples. Multiple test correction was performed across EWCE results using FDR. Non-significant results (FDR > 0.05) were coloured white. ***FDR < 0.001; **FDR < 0.01; *FDR < 0.05. All results available in Supplementary Table 10. b Clustering of shared pathway enrichments using genes identified across the three main analyses (represented by grey bar entitled, “Analysis”). These included: bulk-tissue differential splicing (“Bulk DS”, Supplementary Fig. 12); gene contributions to bulk-tissue gene expression PC1 (“Bulk PC”, Supplementary Fig. 6); and single-nucleus differential expression (“snRNA DEG”, Fig. 3). Pathways (in rows) from all three analyses were filtered to include only those that appear across more than one type of analysis. Pathways are ordered from highest to lowest by the number of gene sets in which they are enriched (as displayed in the bar plot on the right-hand side). Gene sets (in columns) are clustered using hierarchical clustering on the Pearson correlation between gene sets (pathways were encoded with a binary 1 for “Present” or 0 for “Absent”, represented on the plot by black and white, respectively). Gene sets derived from differential splicing (Bulk DS) were collapsed across our own dataset and the replication dataset, resulting in one gene set (column) per pairwise comparison. Likewise, gene sets derived from up- and down-regulated single-nucleus DE gene sets were collapsed across cell types (represented by the coloured bar entitled, “Cell type”), such that each cell type was represented by a single column. Pathway overlaps using pairwise comparisons between disease groups are displayed in Supplementary Fig. 16. ∆PSI delta percent spliced in, GO gene ontology, OPC oligodendrocyte precursor cell

