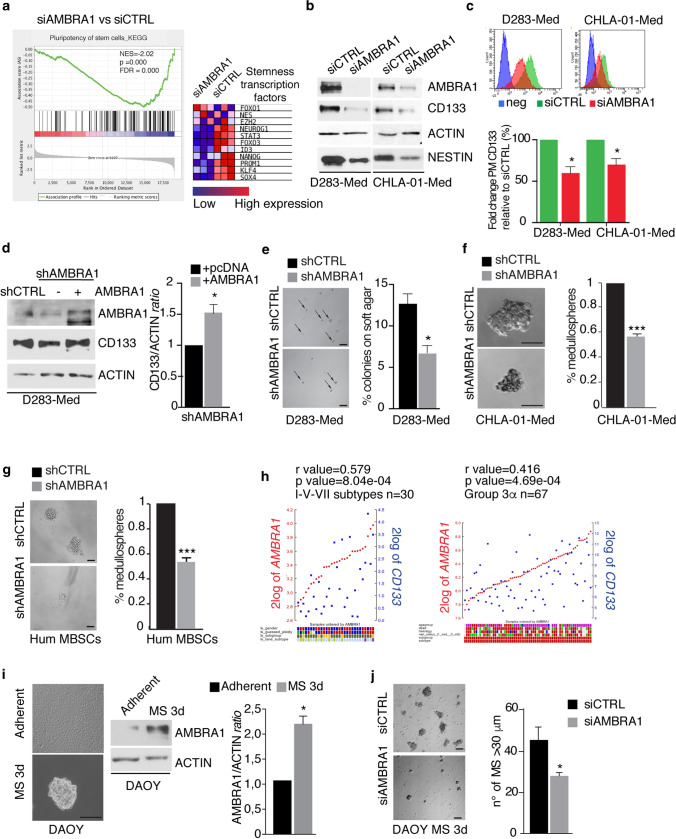
Fig. 3.
Inhibition of AMBRA1 impairs stem potential in various MB cell lines. a GSAA enrichment plot showing that loss of AMBRA1 in D283-Med cells (n = 3 independent experiments) results in downregulation of the pluripotency of stem cell pathway. Right, a heatmap showing the expression of representative stem-related genes in D283-Med cells with (siAMBRA1) or without (siCTRL) AMBRA1 knockdown. Data were generated from RNA-seq analyses. b AMBRA1 expression was downregulated in both D283-Med and CHLA-Med-01 cells using specific RNAi oligonucleotides (siAMBRA1) or unrelated oligos as negative control (siCTRL). Levels of AMBRA1, CD133, NESTIN and ACTIN were analysed by WB. c D283-Med and CHLA-Med-01 cells were treated as in (b). The percentage of plasma membrane (PM) CD133 positive cells was assessed by flow-cytometry. Representative histograms of CD133 mean of fluorescence intensity (MFI) in both D283-Med and CHLA-Med-01 cells are shown. Data are expressed as the mean value ± SEM (n = 3). Data were analysed by unpaired Student's t-test (**p < 0.05). d AMBRA1 expression was downregulated by lentiviral infection (shAMBRA1) or negative control (shCTRL). Then, some of them were transfected with empty or AMBRA1-encoding plasmids, respectively. Levels of AMBRA1, CD133, and ACTIN were analysed by WB. Densitometric analysis of CD133 levels over ACTIN is also shown (right panel). Data are expressed as the mean ± SEM (n = 3) and analysed by unpaired Student's t-test (*p < 0.05). e AMBRA1 was downregulated in D283-Med cells by RNAi. After 24 h, cells were plated on double-layer agar and the number of colonies was assessed after 7 days. Representative images (4 ×) (after 7 days of culture) are shown. Data are expressed as the mean value ± SEM (n = 3). Data are analysed by unpaired Student's t-test (*p < 0.05). f, g Self-renewal ability (percentage of medullospheres) of both CHLA-01-Med cells and primary human MBSCs after AMBRA1 lentiviral downregulation (shAMBRA1). Data are expressed as the mean ± SEM (n = 3) and analysed by unpaired Student's t-test (*p < 0.05). Representative images 40 × scale bar 50 µm (f) and 20 × scale bar 50 µm (g) are shown. h Gene expression correlation analyses between transcripts for AMBRA1 and CD133 in MB samples from both the Pfister (I–V–VII subtypes n = 30) and the Cavalli datasets (G3α n = 67), respectively. Statistically significant positive correlations are shown (r = 0.570 p = 8.04e−04, r = 0.416 p = 4.69e−04). i DAOY cells were cultured as medullospheres for 3 days (3d). Representative images (40 ×) are shown. Scale bar: 50 μm. AMBRA1 and ACTIN levels were analysed by WB. Densitometric analyses of AMBRA1 over ACTIN is also shown (bottom panel). Data are expressed as the mean ± SEM (n = 3) and analysed by unpaired Student's t-test (*p < 0.05). j AMBRA1 expression was downregulated in DAOY cells using specific RNAi oligonucleotides (siAMBRA1) or unrelated oligos as negative control (siCTRL). After 24 h, cells were cultured as medullospheres. Representative images (20 ×) were shown. Amount of medullospheres generated (diameter > 30 μm) were analysed after 3 days of culture. Data are expressed as the mean ± SEM (n = 3) and analysed by unpaired Student's t-test (*p < 0.05)

