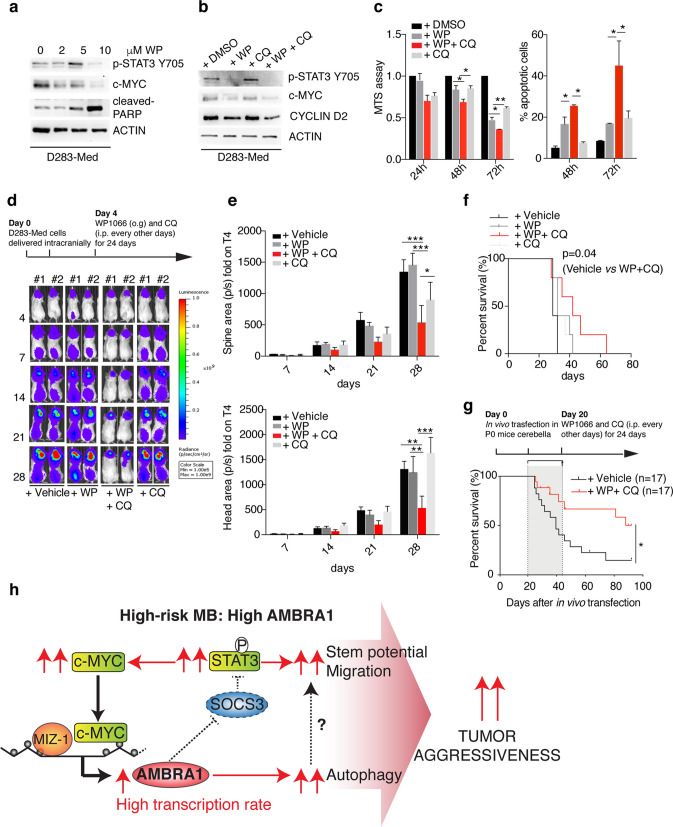
Fig. 8.
Combined targeting of autophagy and STAT3 signalling impairs MBGroup3 progression. a D283-Med cells were treated with a range of WP1066 (WP) concentrations (2, 5, 10 µM). Levels of p-STAT3 (Y705), c-MYC, cleaved-PARP and ACTIN were analysed by WB. b D283-Med cells were treated with WP1066 (10 µM), CQ (40 µM) alone or in combination for 48 h. Levels of p-STAT3 (Y705), c-MYC, CYCLIN D2 and ACTIN were analysed by WB. c D283-Med cells were treated as in (b) for different time periods and proliferation was monitored by MTS assay (left). Data are expressed as the mean ± SEM (n = 6) and data were analysed by one-way analysis of variance (ANOVA) followed by Tukey post hoc test. (*p < 0.05; **p < 0.01; ***p < 0.001). Apoptosis was evaluated by flow-cytometry measuring Annexin V-Propidium iodure positive cells (right). Data are expressed as the mean ± SEM (n = 3) and data were analysed by one-way analysis of variance (ANOVA) followed by Tukey post-hoc test. (*p < 0.05; **p < 0.01). d Representative orthotopic xenograft experiment following injection into the fourth ventricle of NOD scid gamma mouse mice (n = 5) of D283-Med-Luc cells. After 4 days, mice were treated in vivo with vehicle, CQ (i.p. 60 mg/kg every other day), WP1066 (o.g. 40 mg/kg every other day) or combination of both. The mice were imaged at different time points for in vivo bioluminescence acquisition, to monitor tumour growth. e Tumour growth according to quantified photon emission (ph/s) from the region of interest of mice represented in (d). Data are the mean ± SEM (n = 5) and analysed by one-way analysis of variance (ANOVA) followed by Tukey post hoc test (*p < 0.05, **p < 0.01). f Kaplan–Meier survival curve related to the experiment shown in (d). n = 5. p value is determined by the log-rank (Mantel–Cox) test. *p = 0.04. g Kaplan–Meier survival curve of mice injected at P0 with c-Myc and Otx2-encoding vectors and then treated (P20) with vehicle or combination of both CQ (i.p. 60 mg/kg) and WP1066 (i.p. 30 mg/kg) every other day. n = 17. p value is determined by the log-rank (Mantel- Cox) test. *p = 0.0194. h In high-risk MB, AMBRA1 is upregulated in a c-MYC/MIZ-1 dependent manner, thereby activating both the STAT3 pathway and autophagy, this leading to enhanced stem potential, migration and aggressiveness of MB

