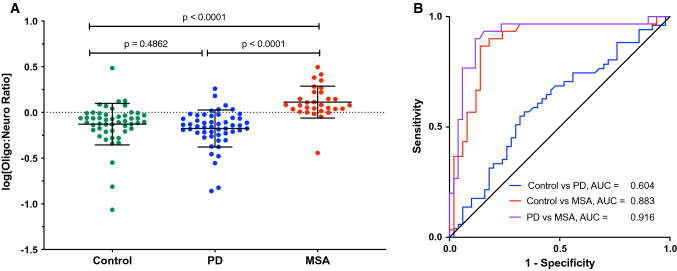
Fig. 2.
The ratio between α-syn concentrations in putative oligodendroglial and neuronal exosomes improves the separation between PD and MSA. a The ratio between the α-syn concentration in putative oligodendroglial and neuronal exosomes was calculated for each sample and log-transformed. The data are presented as mean ± SD. The dashed line indicates the cutoff at 0 (log1). P values were calculated using a one-way ANOVA with post hoc Tukey test. b ROC analysis of the oligodendroglial:neuronal exosome α-syn ratio

