
Fig. 6.
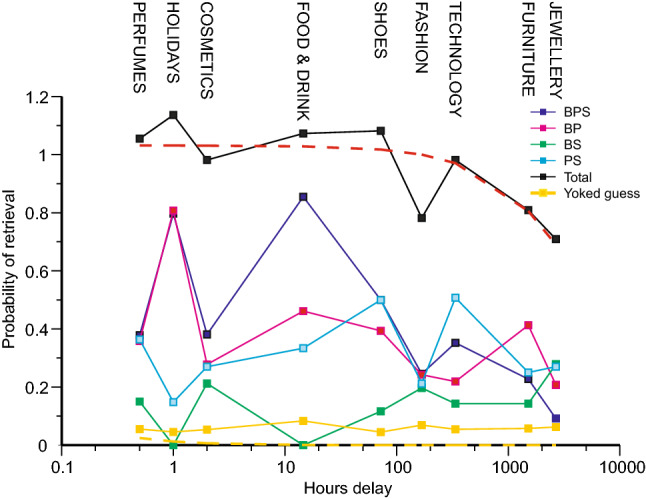
Proportions of retrievals from the original stimuli in relation to the lapse of time since presentation. The broken yellow curve continues the equation in Fig. 5; the broken red curve is a similar equation fit to total probability of recall
Official websites use .gov
A
.gov website belongs to an official
government organization in the United States.
Secure .gov websites use HTTPS
A lock (
) or https:// means you've safely
connected to the .gov website. Share sensitive
information only on official, secure websites.
Proportions of retrievals from the original stimuli in relation to the lapse of time since presentation. The broken yellow curve continues the equation in Fig. 5; the broken red curve is a similar equation fit to total probability of recall