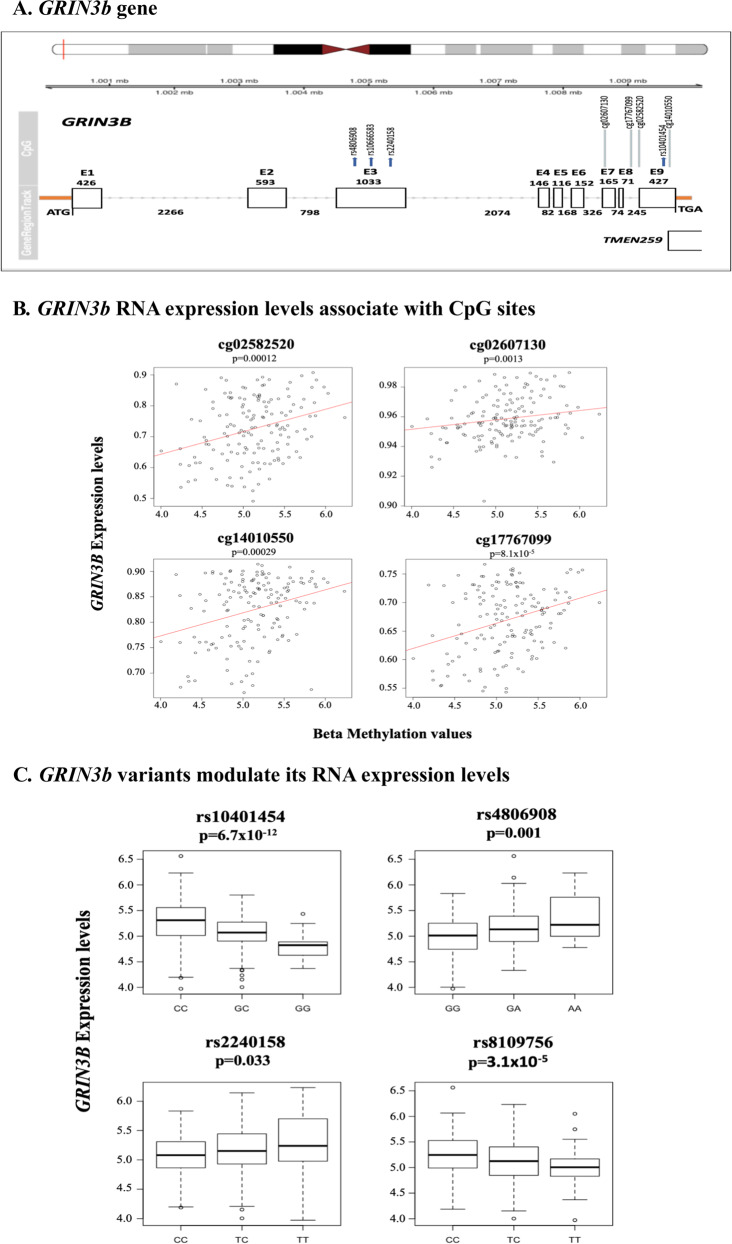
Fig. 2. GRIN3B gene: its RNA expression levels are modulated by CpG loci and DNA variants.
A Schematic representation of the GRIN3B gene and its localization on: chromosome 19 (top of the figure). Each rectangle represents an exon. Numbers above the rectangles are the base pair of each exon; intronic base pair numbers are also indicated. Four variants (rs4806908, rs10666583, rs2240158, and rs1041454) and their localization within the gene and exon are shown; rs8109756 is located near the CNN2 gene and not shown in the figures. None of these SNPs are in LD with each other, despite the close localization. The CpG methylation loci and their localization in the gene are also shown. B Four CpG sites are positive correlated with GRIN3b expression levels. Y-axis shows gene expression values; X-axis represents beta-methylation values. The red line indicates the predicted regression line. C Box and whisker plots of GRIN3b blood RNA expression levels changing with the genotype of the four different variants. Y-axis shows the mRNA expression levels at baseline; X-axis shows the three different genotypes.

