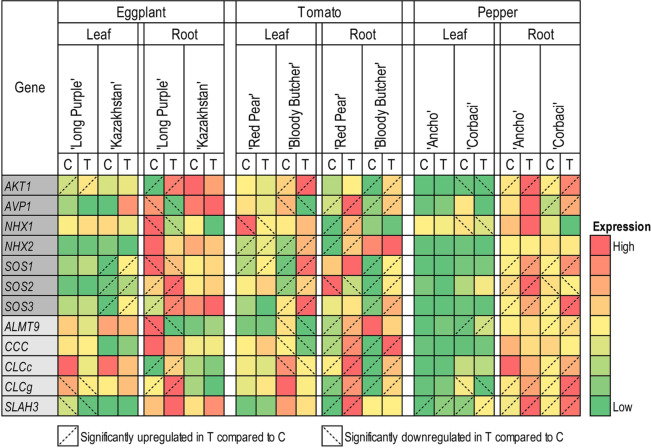
Figure 6.
Heatmap representing the relative expression of salt stress-related genes in roots and leaves of a salt-tolerant and a salt-sensitive cultivar each of the three Solanaceae crops, eggplant, tomato, and pepper. Expression values for each gene are color-coded to depict the fold-change in different cultivars. The genes highlighted in dark gray represent genes involved in Na transport, and the genes highlighted in light green represent genes involved in Cl transport. C, control; T, salinity treatment.

