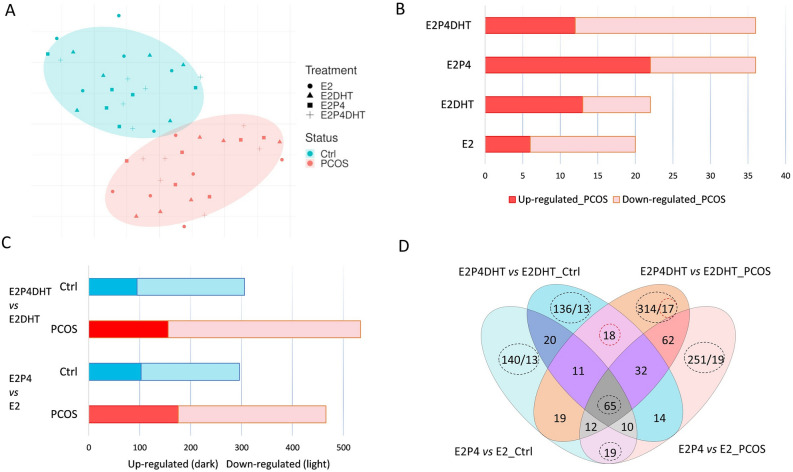
Figure 1.
Quantitative transcriptome differences following steroid hormone exposure. (A) T-distributed stochastic neighbor embedding (t-SNE) plot of differentially expressed genes (DEGs) with FDR (False discovery rate) < 0.05 and absolute log2 fold change (LFC) > 2. Blue and red dots represent respectively endometrial stromal cells (eSCs) from Ctrl and PCOS. (B) Counts of up-regulated (red) and down-regulated (pink) DEGs in response to hormone treatment in PCOS group compared to Ctrl for non-decidualized (non-DE) eSCs post-treated with E2 with or without (±) DHT, and for decidualized (DE) eSCs post-treated with E2P4 ± DHT. (C) Counts of up- and down-regulated DEGs in Ctrl (blue) and PCOS (red) women in non-DE eSCs with E2 ± DHT and in DE eSCs with E2P4 ± DHT. (D) Venn diagram of group-wise comparisons illustrating the counts for the common vs. uniquely expressed DEGs for E2P4 vs. E2 and E2P4DHT vs. E2DHT in Ctrl (blue) and PCOS (red), respectively. E2, estrogen; P4, progesterone; DHT, dihydrotestosterone. The DEG counts, shown as ratios, illustrate the number of DEGs before and after applying Independent Hypothesis Weighting Bonferroni (IHW-BON) corrections for filtering the most significant hits. Validation targets were chosen from the DEG groups marked with a red circle.

