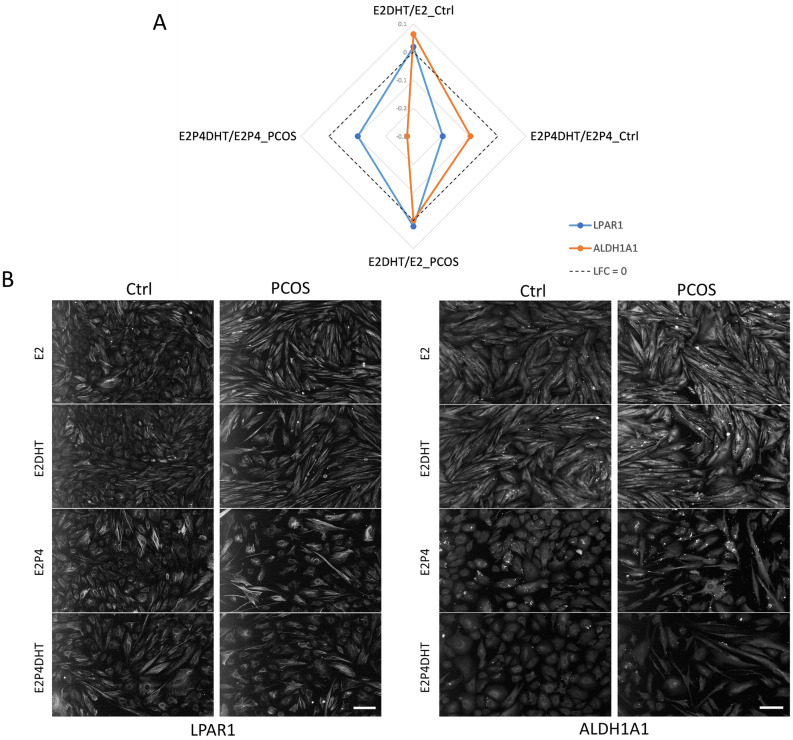
Figure 3.
Validation of in vitro protein expression by immunofluorescence (IF). (A) Radar plot showing in vitro effect of DHT on expression of LPAR1 (blue) or ALDH1A1 (orange) in non-DE eSCs with E2 ± DHT and in DE-eSCs with E2P4 ± DHT in both groups (Ctrl, PCOS; both n = 3). The y-axis shows log fold change (LFC) values calculated for ratios with and without DHT; LFC 0 line (no change in expression) is shown in dotted black. (B) IF panel for LPAR1 and ALDH1A1 protein expression in non-DE-eSCs with E2 or E2DHT post-treatment and DE-eSCs with E2P4 or E2P4DHT post-treatments in eSCCtrl and eSCPCOS; nuclei are stained with DAPI. Scale bar: 100 µm.

