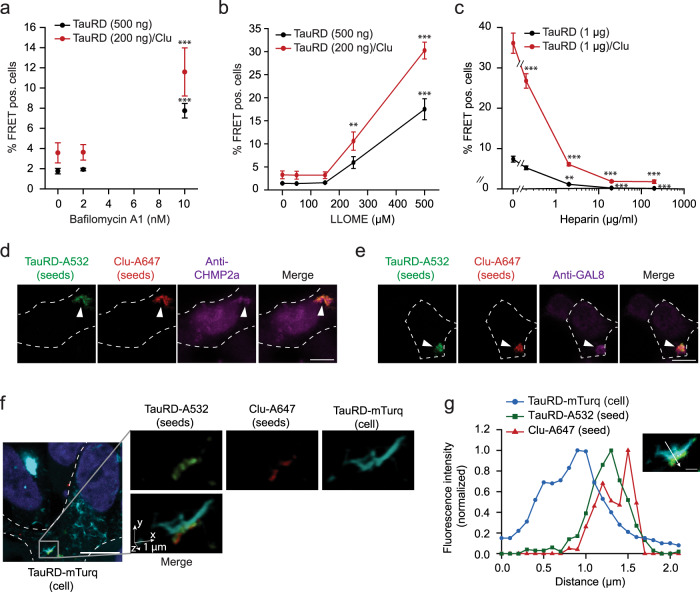
Fig. 4. Uptake of Clusterin-associated, seeding competent Tau aggregates by endocytosis.
a, b Effect of inhibition of lysosomal H+ ATPase by Bafilomycin A1 (a) and permeabilization of acidic membrane compartments with LLOME (b) on seeding potency of TauRD aggregates formed with or without Clu. TauRD-YT cells were treated with increasing concentrations of the inhibitors in combination with 500 ng TauRD seeds or 200 ng TauRD/Clu seeds without a transfection reagent. FRET positive (pos.) cells were analyzed after 48 h. Data represent the mean ± SEM (n = 5 independent experiments). Significance is represented relative to control cells treated with the vehicle without Bafilomycin A1 or LLOME. **p < 0.01, ***p < 0.001 by two-way ANOVA with Sidak post hoc test (TauRD vehicle vs. TauRD 10 nM Bafilomycin A1 p = 2.9 × 10⁻⁵; TauRD/Clu vehicle vs. TauRD/Clu 10 nM Bafilomycin A1 p = 3.9 × 10⁻⁴; TauRD vehicle vs. TauRD 500 µM LLOME p = 4 × 10⁻¹⁰; TauRD/Clu vehicle vs. TauRD/Clu 250 µM LLOME p = 0.002; TauRD/Clu vehicle vs. TauRD/Clu 500 µM LLOME p < 1 × 10⁻¹⁵). c Heparan sulfate proteoglycan (HSPG) mediated internalization of TauRD and TauRD/Clu aggregates. TauRD-YT cells were treated with increasing concentrations of heparin in combination with 1 µg TauRD seeds or TauRD/Clu seeds without a transfection reagent. FRET positive (pos.) cells were analyzed after 48 h. Data represent the mean ± SEM (n = 4 independent experiments). Significance is represented relative to control cells treated with the vehicle without heparin. **p < 0.01, ***p < 0.001 by two-way ANOVA with Sidak post hoc test (TauRD vehicle vs. TauRD 2 µg/ml heparin p = 0.0017; TauRD vehicle vs. TauRD 20 µg/ml heparin p = 3 × 10⁻⁴; TauRD vehicle vs. TauRD 200 µg/ml heparin p = 2.5 × 10⁻⁴; TauRD/Clu vehicle vs. TauRD/Clu 0.2 µg/ml heparin p = 4.4 × 10⁻⁶; TauRD/Clu vehicle vs. TauRD/Clu 2 µg/ml heparin, TauRD/Clu vehicle vs. TauRD/Clu 20 µg/ml heparin and TauRD/Clu vehicle vs. TauRD/Clu 200 µg/ml heparin p < 1 × 10⁻¹⁵). d, e Colocalization of TauRD/Clu seeds (TauRD-A532 in green, Clu-A647 in red) (arrowheads) with the endocytosis marker CHMP2a (magenta) (d) and the marker of ruptured endomembranes, galectin-8 (GAL8; magenta) (e) in TauRD-T cells. A representative result of confocal imaging is shown. The cell outline is indicated by a white dashed line. Scale bar, 10 μm. (n = 3 independent experiments). f, g Colocalization of TauRD/Clu seeds with endogenous TauRD-mTurquoise2 (TauRD-mTurq) aggregates. f A representative slice from a confocal stack is shown (scale bar, 10 µm) where cells are outlined with a white dashed line. One aggregate region, marked with a square in the slice, is represented by volume rendering (1 µm scale bars indicated by arrows). Channels are also displayed separately. TauRD-A532 seed in green, Clu-A647 in red, endogenous TauRD aggregate in turquoise. (n = 3 independent experiments). g Quantification of relative fluorescence intensity in the aggregate shown in the inset. TauRD-mTurq (blue), TauRD-A532 (green) and Clu-A647 (red). The colocalization line profile on a mid focal plane (inset image) along the white arrow is shown. Scale bar, 1 μm.

