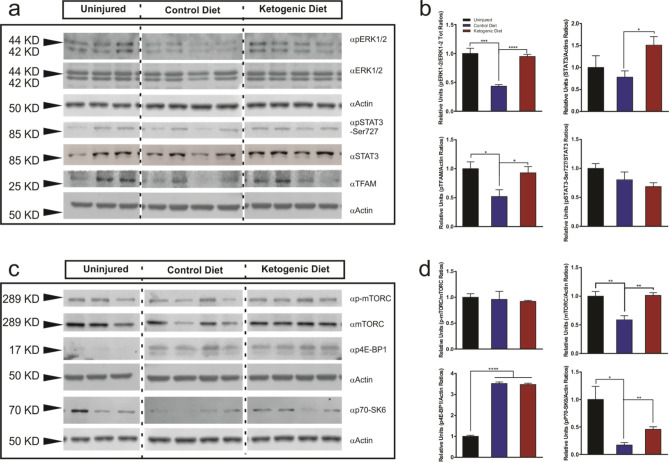
Figure 4.
Western blot analysis of mTFAM and members of the MAPK, mTOR and STAT signaling pathways after KD treatment in spinal cord tissue homogenates. (a) Immunoblots showing an increase in ERK1/2 phosphorylation at the Thr42/44 epitope, increased mTFAM and total Stat3 expression in injured spinal cords after KD treatment. (b) Quantifications of blots in (a). (c) Immunoblots showing an increase in p70-S6K phosphorylation at the Thr202/Tyr204 epitope and an increase in total mTOR expression in injured spinal cords after KD treatment. (d) Quantifications of blots in (c). One-way ANOVA, Fisher’s LSD Post-hoc test. All data are mean ± SEM. The blots from the same gels were cropped and rearranged in the following order: Uninjured, Control Diet, Ketogenic Diet; to make them more clear and enhance reader’ understanding of the figure and the subsequent quantifications. Membranes were cut previous incubation with primary antibodies in order to optimize limited sample use. Full-length blots/gels are presented in Supplementary Fig. 5.

