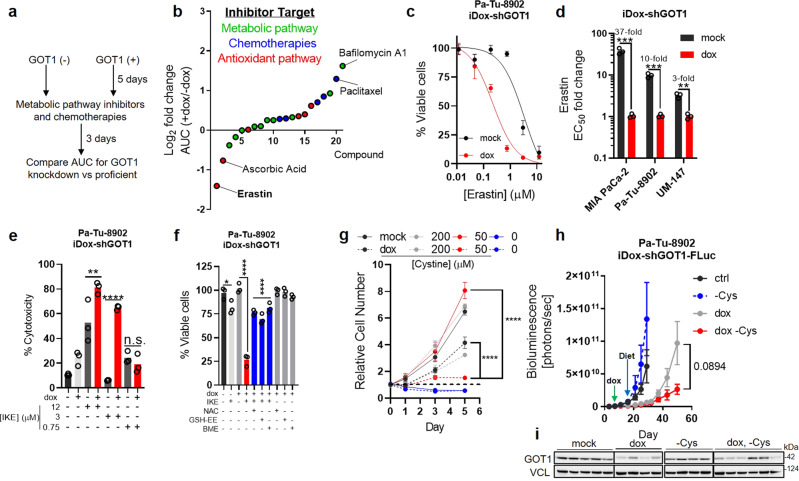
Fig. 2. PDA requires cystine for viability and growth following GOT1 inhibition.
a Screening strategy to identify metabolic dependencies following GOT1 suppression. b Log2 fold change in area under the curve (AUC) from cell viability dose response curves corresponding to each point, n = 3 biological replicates. c Cell viability dose response to erastin comparing mock (black) and GOT1 knockdown (red). d GOT1 sensitization represented as the fold change in the erastin EC50, n = 3 biological replicates, ***P = 0.000526, ***P = 0.000206, **P = 0.001204. e % Cytotoxicity following GOT1 knockdown and IKE (Imidazole ketone erastin) treatment for 24 h. Cytotoxicity was measured by LDH (Lactate dehydrogenase) release and normalized to a cell lysis control, n = 3 biological replicates, **P = 0.0044, ****P < 0.0001, n.s. P = 0.9838. f Cell viability of Pa-Tu-8902 iDox-shGOT1 after 5 days of GOT1 knockdown then 24 h of 750 nM IKE combined with the indicated conditions. 250 μM of N-acetyl-cysteine (NAC), 250 μM GSH-ethyl ester (GSH-EE), and 50 μM of beta-mercaptoethanol (BME) were used (n = 3 biological replicates), *P = 0.0254, ****P < 0.0001, ****P < 0.0001. g Proliferation following GOT1 knockdown and the indicated media conditions (n = 3 biological replicates), ****P < 0.0001, ****P < 0.0001. h, i Orthotopic xenograft tumor growth from Pa-Tu-8902 iDox-shGOT1 stable cell lines co-expressing firefly luciferase (FLuc) treated with vehicle (black, n = 6 mice), dox-containing food (gray, n = 6 mice), cysteine-free diet (-Cys) (blue, n = 5 mice), or dox-containing, cysteine-free food (red, n = 6 mice), n.s. P = 0.0894. GOT1 immunoblot (i) taken from endpoint tumors. Immunoblot in (i) is representative of two independent experiments. Error bars represent mean ± SD in b–g or mean ± SEM in (h). Two-tailed unpaired T-test or one-way ANOVA. Source data are provided as a Source Data file.

