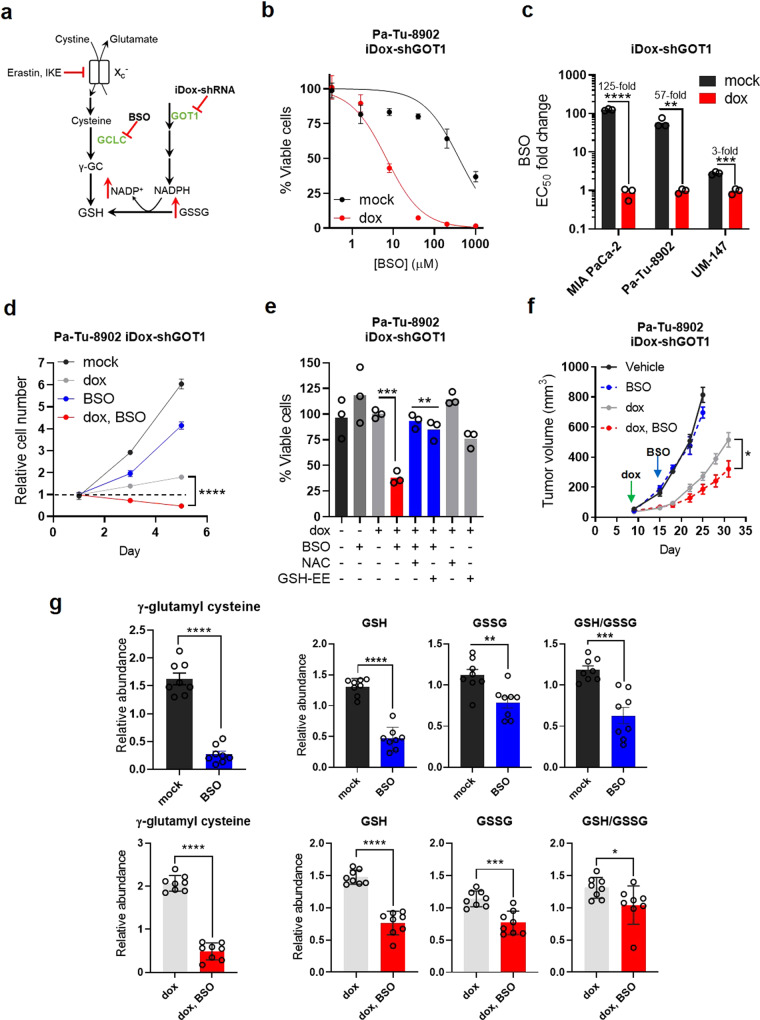
Fig. 3. PDA require GSH synthesis for growth upon GOT1 suppression.
a Scheme depicting GSH synthesis and metabolic changes following GOT1 inhibition. b Cell viability dose response, n = 3 biological replicates. c EC50 fold change across multiple PDA cell lines (****P = 0.000008, **P = 0.003905, ***P = 0.000359) following 5 days of GOT1 knockdown and BSO treatment, n = 3 biological replicates. d Proliferation (****P = < 0.0001) following 5 days of GOT1 knockdown and BSO treatment, n = 3 biological replicates. e Cell viability following 72 h of 40 μM BSO or co-treatment with 0.5 mM N-acetyl cysteine (NAC) or 0.5 mM GSH-Ethyl Ester (GSH-EE) following 5 days of GOT1 knockdown (n = 3 biological replicates), ***P = 0.0006, **P = 0.002, **P = 0.0087. f Subcutaneous xenograft growth of Pa-Tu-8902 iDox-shGOT1 cells treated with vehicle (black), 20 mg/kg BSO via drinking water (blue), doxycycline administered in the food (gray), or the combination (red), *P = 0.0193. g Relative abundance of gamma-glutamyl cysteine (γGC) (****P ≤ 0.0001 mock/BSO and ****P < 0.0001 dox/dox, BSO), GSH (****P ≤ 0.0001, ****P < 0.0001) GSSG (**P = 0.0041, ***P = 0.0003) and the GSH/GSSG ratio (***P = 0.0002, *P = 0.0469) from tumors in (f) (n = 8). Error bars represent mean ± SD or ± SEM (f, g). Two-tailed unpaired T-test or one-way ANOVA. Source data are provided as a Source Data file. xc- system xc, γGC gamma-glutamyl cysteine, BSO buthionine sulfoximine, GSH, reduced glutathione, GSSG oxidized glutathione.

