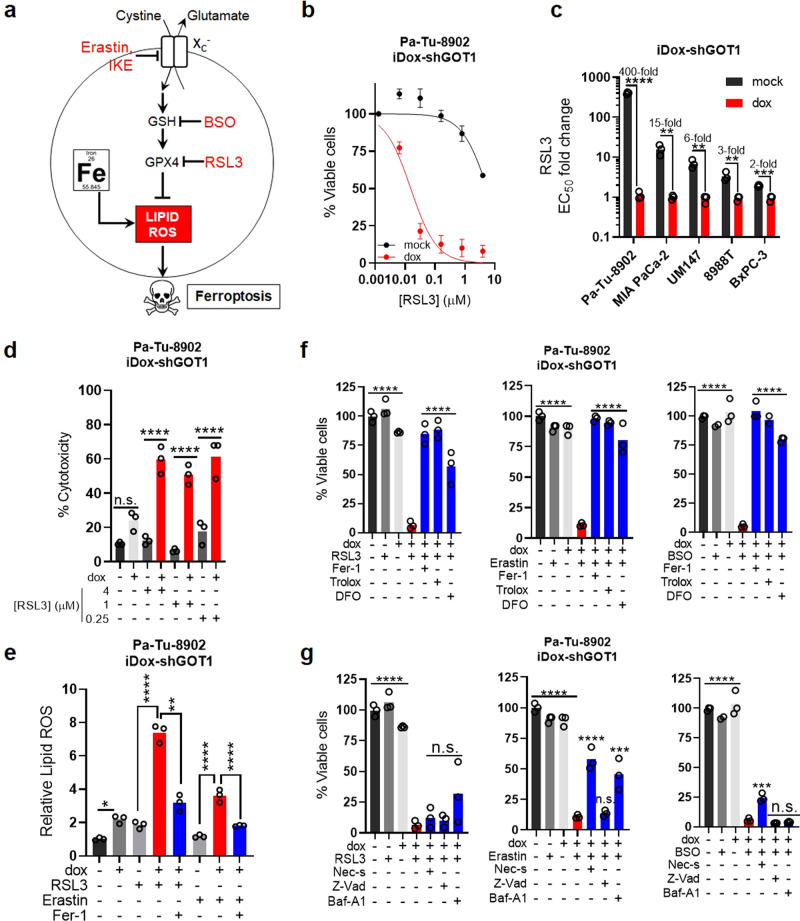
Fig. 4. GOT1 inhibition potentiates ferroptosis.
a Scheme of the GPX4 arm of ferroptosis. b Cell viability dose response curve at 24 h, n = 3 biological replicates. c EC50 fold changes in dose response following GOT1 knockdown and RSL3 treatment, n = 3 biological replicates, ****P ≤ 0.0001, **P = 0.005128, **P = 0.003314, **P = 0.008921, ***P = 0.000691. d % Cytotoxicity following GOT1 knockdown and RSL3 treatment at 24 h. Cytotoxicity was measured by LDH (Lactate dehydrogenase) release and normalized to a cell lysis control, n = 3 biological replicates, n.s. P = 0.1763, ****P = < 0.0001, ****P < 0.0001, ****P < 0.0001. e Relative lipid ROS in Pa-Tu-8902 iDox-shGOT1 treated with 32 nM RSL3 or 750 nM Erastin −/+ 1 μM Ferrostatin-1(Fer-1) for 6 h (n = 3 biological replicates), **P = 0.0057, ****P < 0.0001,****P < 0.0001,****P < 0.0001. f Cell viability of Pa-Tu-8902 iDox-shGOT1 cultured in vehicle (0.1% DMSO) −/+ dox (black and light gray), drug (32 nM RSL3, 750 nM Erastin, 40 μM BSO) −/+ dox (gray and red), or drug and dox (blue) in the presence of lipophilic antioxidants 1 μM Fer-1 and 100 μM Trolox, or an iron chelator 10 μM DFO (deferoxamine), ****P ≤ 0.0001 dox and dox/RSL3, Erastin, BSO; ****P < 0.0001 dox/RSL3 and dox/RSL3, Erastin, BSO/Fer-1, Trolox, DFO. Viability was assessed after 24 h of treatment for RSL3 and Erastin conditions and 72 h for BSO treatment conditions. GOT1 was knocked down for 5 days prior to treatment. Data are normalized to the –dox and vehicle-treated control (n = 3 biological replicates). g Cell viability following the procedure in (f) but in the presence of 10 μM Necrostatin-1 (Nec-s, necroptosis inhibitor), 50 μM ZVAD-FMK (Z-Vad, apoptosis inhibitor), or 1 nM bafilomycin A1 (BA-1, lysosomal acidification inhibitor), n = 3 biological replicates, ****P ≤ 0.0001 dox and dox/RSL3, Erastin, BSO; dox/Erastin, dox/Erastin/Nec-s, ****P ≤ 0.0001; dox/Erastin, dox/Erastin/Baf-A1, ***P = 0.0002. dox/BSO, dox/BSO/Nec-s, ***P = 0.0021. Error bars represent mean ± SD. Two-tailed unpaired T-test or one-way ANOVA: Non-significant P > 0.05 (n.s., as noted). Source data are provided as a Source Data file. GPX4 glutathione peroxidase 4.

