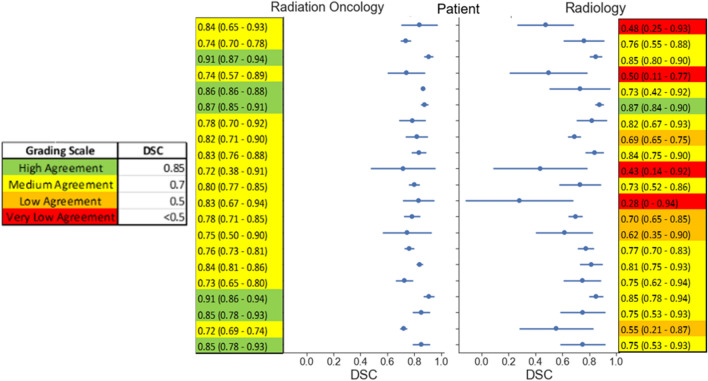
Figure 2.
Dice Similarity Coefficient. Center vertical plot shows the mean DSC values (solid dot) with standard deviations (line through dot) for each CT image, separated discipline. Tables adjacent to the plot indicate the numerical values of the mean and standard deviation. DSC values were obtained by pair-wise comparison of the observer contour and STAPLE consensus contour. The legend illustrates the distribution of thresholds used to identify different levels of agreement.

