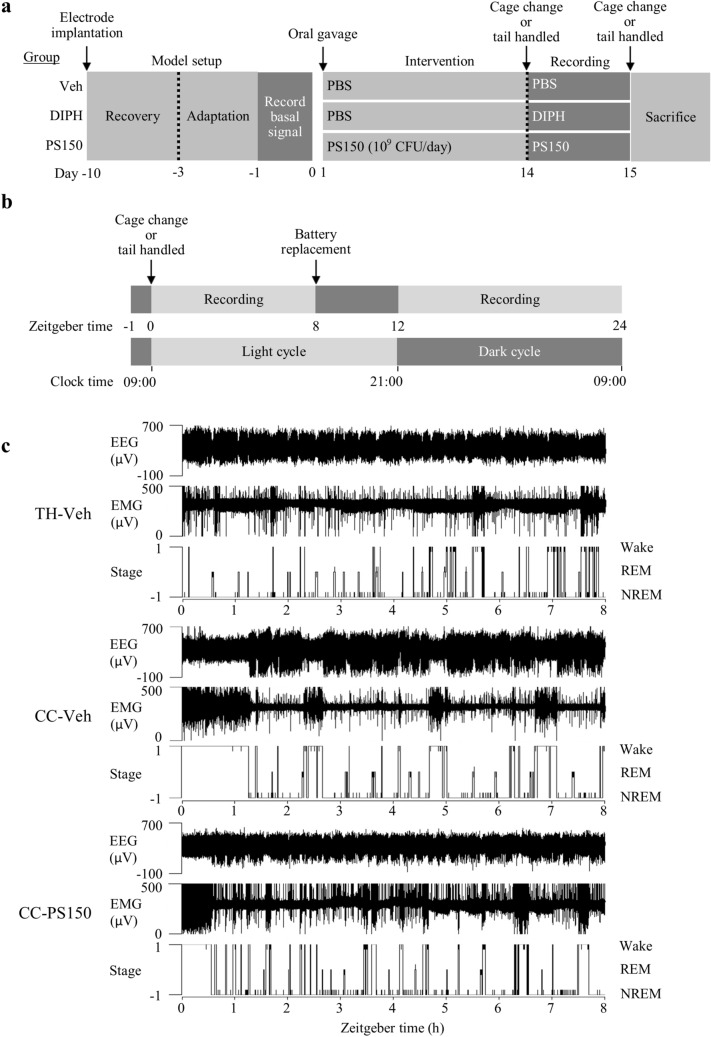
Figure 1.
Schematic view of the experimental design for polysomnographic recording. (a) Experimental flow chart of the animal model. The probiotic intervention was performed 10 days after electrode implantation and proceeded for 14 days. The cage change procedure was performed before polysomnographic recording on day 14 and repeated before sacrifice on day 15. (b) Experimental flow chart of polysomnographic recording on day 14. Zeitgeber time (ZT) 0 was defined as 0900 h when the light was turned on. (c) Representative polysomnographs. Continuous analysis of representative data recorded at ZT 0–8 from tail-handled control (TH-Veh), cage change control (CC-Veh), and cage change PS150-treated (CC-PS150) groups are shown.

