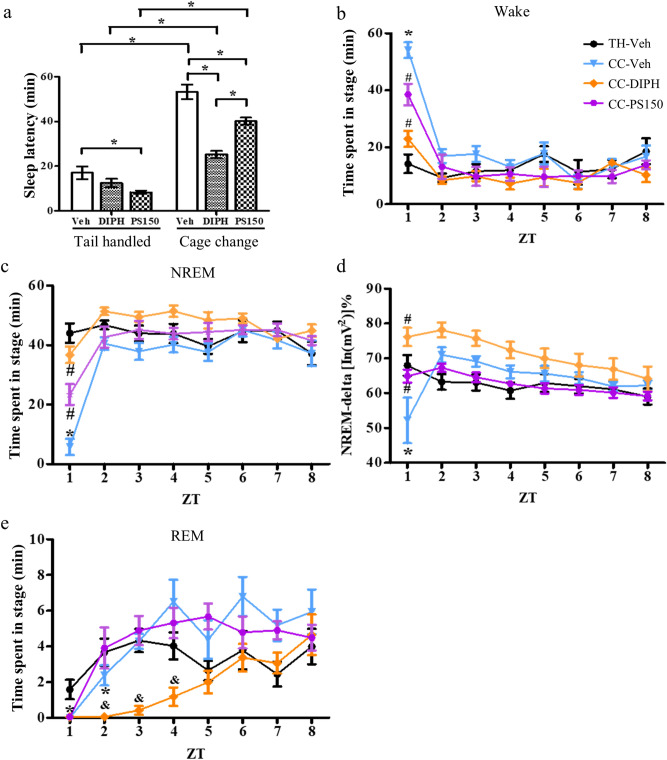
Figure 4.
Time-dependent alterations in vigilance and sleep stages during the light phase. (a) Sleep latency of each group. Latency was defined as the time between the cage change procedure and the first non-rapid eye movement (NREM) sleep that lasted longer than 5 min. (b,c) The amount of wake and NREM states in each hour. Data from the unchanged control (TH-Veh), cage change control (CC-Veh), cage change positive control (CC-DIPH), and cage change PS150-treated (CC-PS150) groups are colored black, blue, orange, and violet, respectively. (d) The relative intensity of NREM-delta power in each hour. (e) Accumulated amount of REM states in each hour. Data are expressed as the mean ± SEM (n = 7–9). For sleep latency, data were analyzed using two-way ANOVA with Bonferroni correction. For the effect of treatment in each hour, data were analyzed using one-way ANOVA with Tukey’s post hoc test. (*p < 0.05, compared to TH-Veh; #p < 0.05, compared to CC-Veh. &p < 0.05, compared to CC-Veh and CC-PS150).

