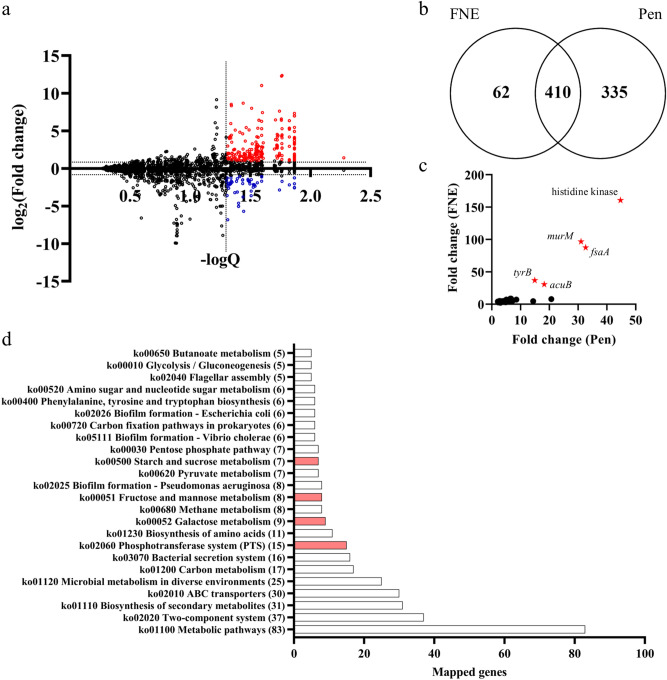
Figure 6.
Differential predictive metagenome composition of the fecal microbiota. (a) Overall distribution of the predictive metagenome composition. The fold change (PS150/control) of predicted gene copy numbers from the cage change group was plotted against statistical significance (Q value). Significantly enriched and reduced genes in the PS150 group are colored red and blue, respectively. (b) Venn diagram of significantly enriched genes from this study (FNE) and our previous pentobarbital-induced sleep model (Pen). (c) Abundant genes enriched in the microbiota of the PS150 group from both mouse models. Only genes with an estimated composition > 100 ppm of the metagenome were plotted. The top five coenriched genes are labeled with a red star, including histidine kinase, serine/alanine adding enzyme (murM), fructose-6-phosphate aldolase 1 (fsaA), aromatic-amino-acid transaminase (tyrB), and acetoin utilization protein (acuB). (d) Pathway mapping of the 410 coenriched genes from both models using the Kyoto Encyclopedia of Genes and Genomes (KEGG) database. Phosphotransferase (PTS) systems and the related carbohydrate metabolic pathways are colored red.

