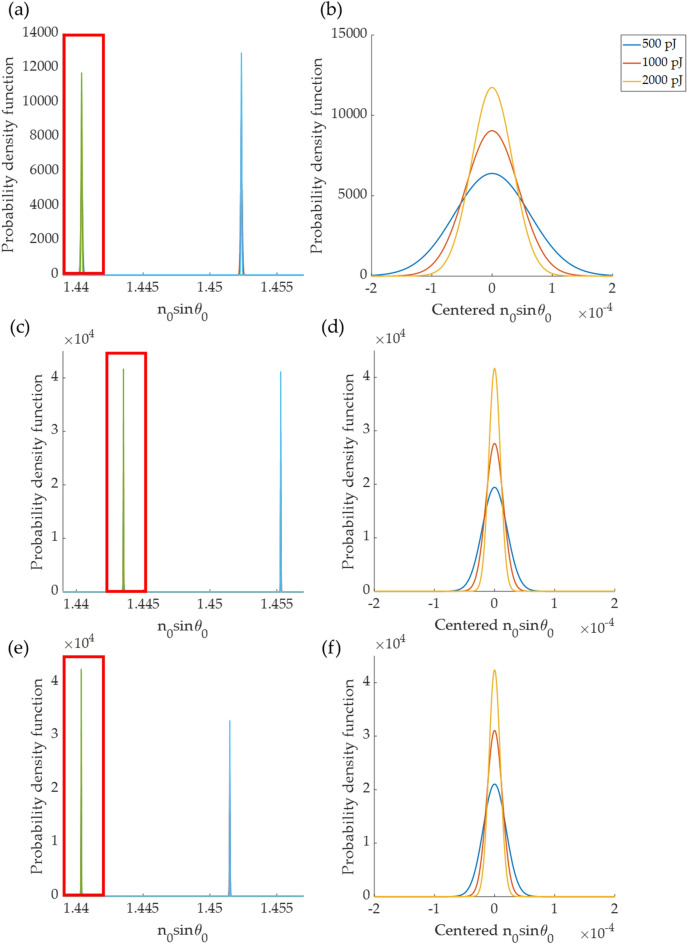
Figure 12.
Shows probability density functions of plasmonic dip positions for different photon energy levels of 500 pJ, 1000 pJ, and 2000 pJ calculated for 3 plasmonic dip measurement methods. (a) 3rd-degree polynomial curve fitting in intensity line scan image, (b) zoomed-in curves of (a) in the highlighted curves, (c) 45-degree azimuthal averaging, (d) zoomed-in curves of (c) in the highlighted curves, (e) the DL-based method, and (f) zoomed-in curves of (e) in the highlighted curves.

