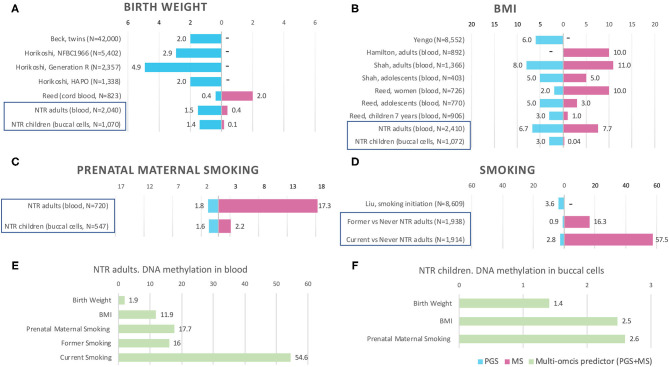
Figure 1.
Prediction by methylation and polygenic scores in previous studies and NTR. Bars are the phenotypic variance explained by the score (R2), x-axis shows R2 in %. MS, methylation score. PGS, polygenic score. PGS+MS, polygenic and methylation scores in combined model (multi-omics predictor). “–” indicates that the score is not available in the study. Prediction by PGS and MS separately in NTR cohorts is indicated by blue frames in (A–D). Multi-omics prediction in NTR is presented in (E–F). Full references on previous studies in (A,B,D) can be found by first author in References. For more details on previous EWASs included in (A,B), see Supplementary Table 1.

