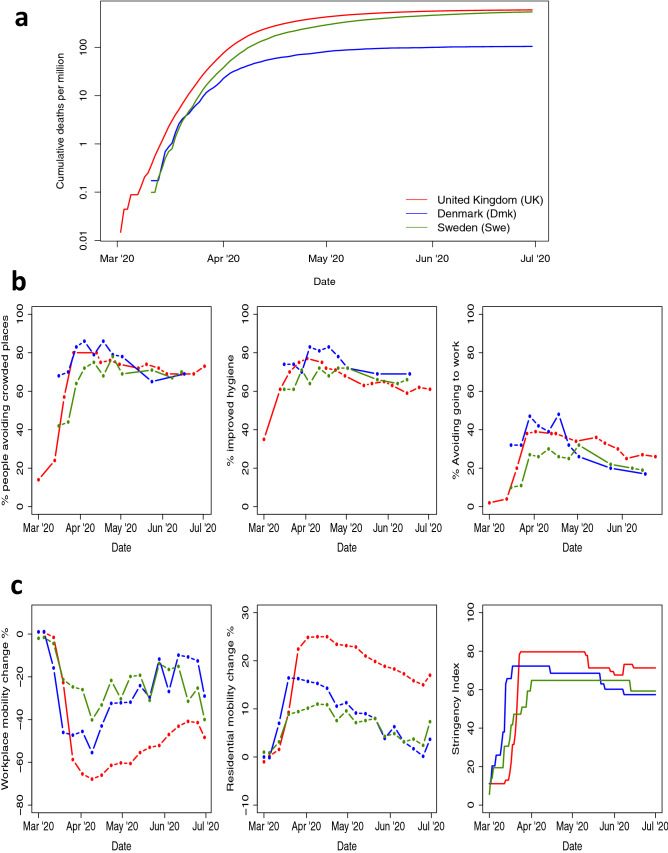
Figure 1.
Responses to the COVID-19 epidemic in the UK (red), Denmark (Blue) adn Sweden (Green). (a) Cumulative laboratory-confirmed COVID-19 deaths per million by date of death. (b) Results of YouGov surveys of population behavioural responses to COVID-191. The percentage of people: avoiding crowded public places (left); who report improved personal hygiene, e.g. frequent hand washing/using hand sanitiser (centre); avoiding going to work (right). (c) Google COVID-19 community mobility report data2 giving change from baseline in mobility associated with workplaces (left), and in residential mobility (i.e. time spent at home) (centre). Right plots the OxCGRT COVID-19 intervention stringency index3 measuring the number of COVID-19 policies present at any given time.

