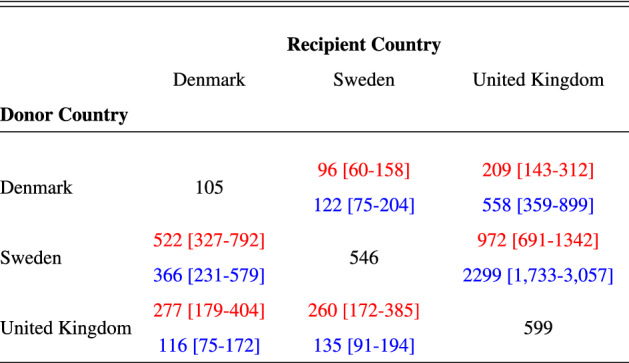
Table 1.
COVID-19-attributed deaths per million for the UK, Denmark and Sweden until 1st July 2020. Diagonal elements show observed mortality (black text), off-diagonal elements show mortality (median with 95% credible intervals) for counterfactual scenarios. Top red text in each row denotes counterfactuals estimated using the absolute transposition approach. Bottom blue text in each row denotes counterfactuals estimated using the relative transposition approach.

