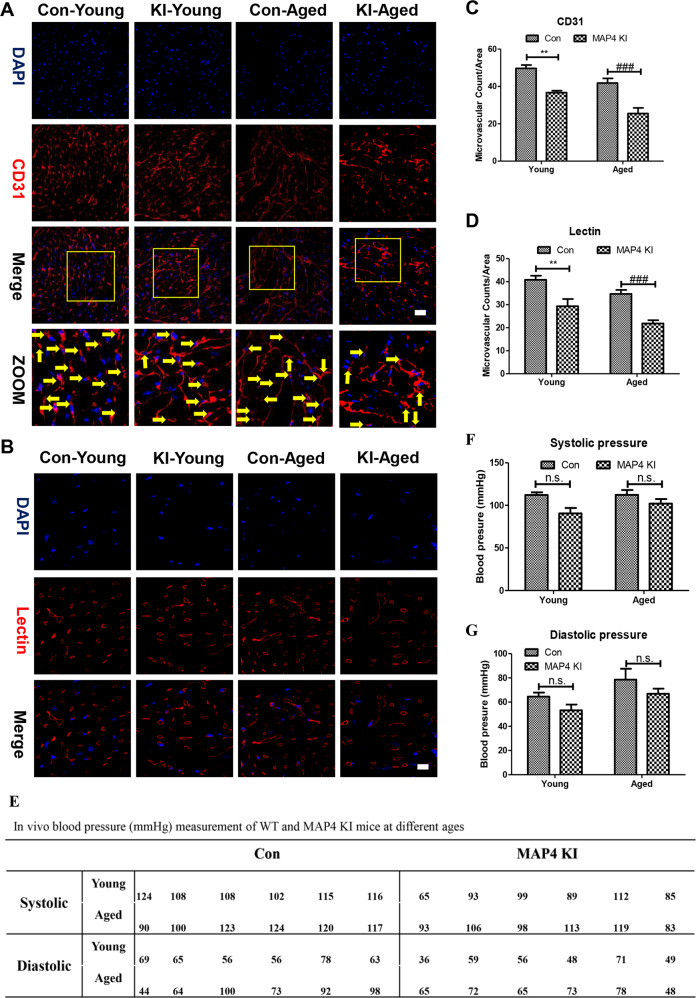
Fig. 2. Reduced cardiac microvascular density in the myocardium of MAP4 KI mice.
A Representative confocal images of CD31 in the myocardium. Scale bar, 10 µm; n = 3. Yellow arrows point to capillary. B Representative confocal images of lectin in the myocardium. Scale bar, 10 µm; n = 3. C A scatter diagram showing the statistical analysis of microvascular density in myocardium stained with CD31. N.S. represents no statistical difference between the Con-young and MAP4 KI-young groups. **p < 0.01 versus the Con-young group; ###p < 0.001 versus the Con-aged group. D A scatter diagram showing the statistical analysis of red circles in myocardium stained with lectin. **p < 0.01 versus the Con-young group; ###p < 0.001 versus the Con-aged group. E In vivo blood pressure measurement of WT and MAP4 KI mice at different ages. F Statistical analysis of Systolic pressure in (A). N.S. represents no statistical difference; n = 6. G Statistical analysis of Diastolic pressure in (A). N.S. represents no statistical difference; n = 6.

