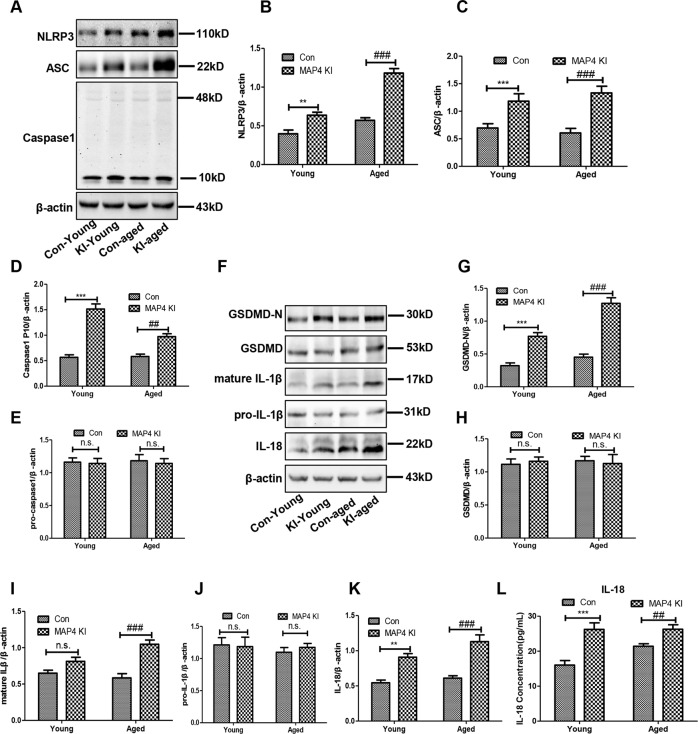
Fig. 3. Activated NLRP3-related pyroptosis in the myocardium of MAP4 KI mice.
A Representative immunoblotting bands of NLRP3, ASC, caspase-1 (p10), and pro-caspase-1 in the myocardium; n = 5. B–E The statistical analysis of NLRP3, ASC, and Caspase-1. **p < 0.01 and ***p < 0.001 versus the Con-young group. ##p < 0.01 and ###p < 0.001 versus the Con-aged group. N.S. represents no statistical difference; n = 5. F Representative immunoblotting bands of GSDMD-N, GSDMD, pro-IL-1β, mature IL-1β, and IL-18 in the myocardium; n = 5. G–K The statistical analysis of GSDMD-N, GSDMD, pro-IL-1β, mature IL-1β, and IL-18. **p < 0.01 and ***p < 0.001 versus the Con-young group. ###p < 0.001 versus the Con-aged group. N.S. represents no statistical difference; n = 5. L A scatter diagram showing the concentration of IL-18 in the plasma. ***p < 0.001 versus the Con-young group. ##p < 0.001 versus the Con-aged group; n = 8.

