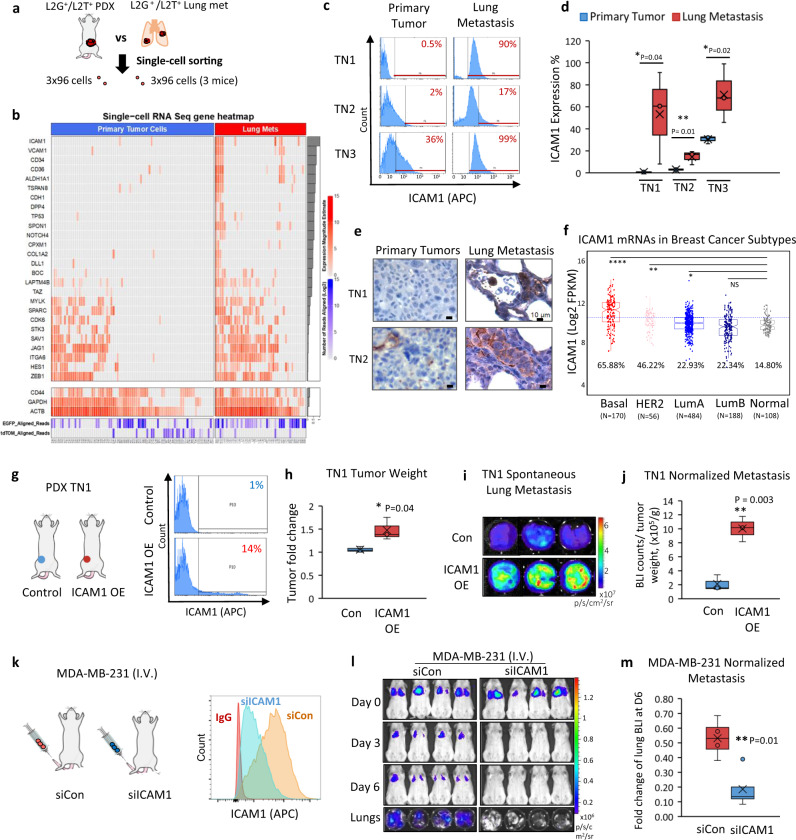
Fig. 1. Single-cell RNA sequencing profiles comparing breast cancer cells from primary and metastatic tumor sites.
a A schematic showing the single-cell RNA sequencing of the sorted cells from L2T- or L2G-labeled TNBC PDX (mice 1 and 2) or MDA-MB-231 tumor (mouse 3)-bearing mice, both primary breast tumors and lung metastases (early micrometastases). b Heatmap denoting expression magnitude estimates in log scale (red color) for ICAM1 and co-expressed stemness signature genes in primary tumor cells and lung metastases (N = 3 mice, 2 with TN PDXs and 1 with MDA-MB-231 tumor). Genes are sorted according to their correlation with ICAM1 across all cells, as denoted by the gray bars on the right (top highest to bottom lowest). The bottom list of CD44, GAPDH, ACTB, eGFP, and tdTomato serve as control genes without significant changes between primary tumor cells and lung metastases. c Representative ICAM1 expression in L2T+ or L2G+ primary tumor cells and lung metastases determined by flow cytometry from different breast cancer PDX models (TN1, TN2, and TN3). Flow profile gates are shown in Supplementary Fig. 1d. d Quantitative data of the differential ICAM1 expression in PDX primary tumors versus lung metastasis from c. n = 3 biological replicates (mice) for each model. One-sided t test *P = 0.04; **P = 0.01; *P = 0.02. The boxes range from the first to third quartile with x in a box indicating mean value and whisker lines extending to outliers (minimum and maximum). e Representative IHC staining images of ICAM1 expression (brown color) in primary tumors and lung metastases from PDX TN1 and TN2 models validating c and d. f Distribution of ICAM1 expression across PAM50 subtypes in the TCGA BRCA cohort (N = 1037). Basal-like and HER2-enriched subtypes are the top two exhibiting significantly higher ICAM1 expression as compared to normal breast tissue (percentage of cases above the blue line value are shown for each subtype). Statistical significance was assessed using a two-sided Student’s t test. *P < 0.05, **P < 0.01, and ****P ≤ 0.0001. g Schematic and flow histogram analyses of the orthotopically implanted TN1-PDX tumors with or without ICAM1 overexpression (OE) at the 4th mammary fat pads. h. PDX TN1 tumor weights 2 months after orthotopic injections of TN1 cells with ICAM1 OE and control vector (Con) (2.5e5 cells into one mammary fat pad/mouse). n = 3 mice per cell group. Two-sided t test *P = 0.04. The boxes range from the first to third quartile with x in a box indicating mean value and whisker lines extending to outliers (minimum and maximum). i, j Representative lung images and normalized BLI signals (total flux) of spontaneous lung metastases in orthotopically implanted ICAM1 OE and control TN1 tumor-bearing mice as in g, h. n = 3 mice per group. Two-sided t test **P = 0.003. The boxes range from the first to third quartile with x in a box indicating mean value and whisker lines extending to outliers (minimum and maximum). k Schematic and flow histogram analyses of tail vein injected MDA-MB-231 tumor cells transfectd with siRNA control (siCon) and siICAM1. l, m. Representative images and quantitative data of BLI signal of mice injected with siCon and siICAM1-transfected MDA-MB-231 cells via tail vein (n = 4 mice per cell group. Two-sided t test **P = 0.01 for time point comparisons. N = 6 independent experiments). The boxes range from the first to third quartile with x in a box indicating mean value and whisker lines extending to outliers (minimum and maximum).

