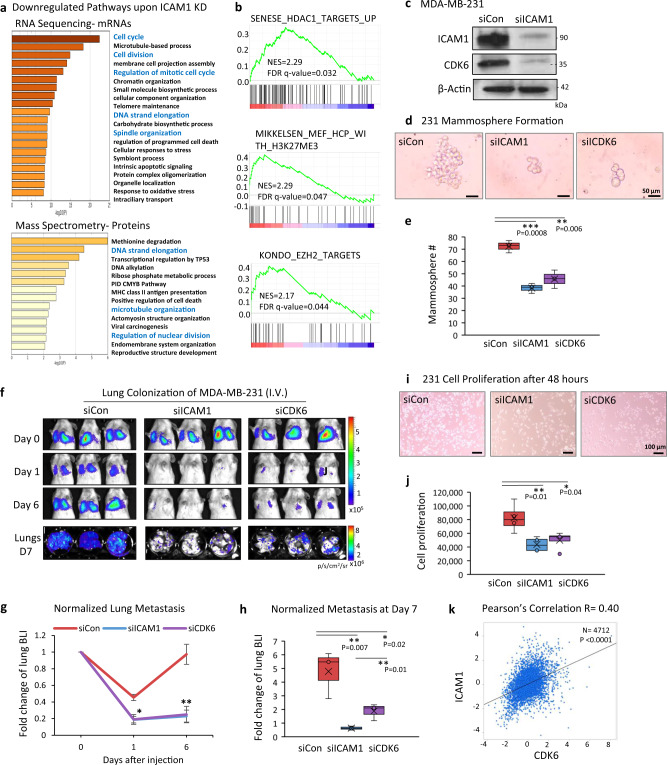
Fig. 3. Downstream targets of ICAM1 in regulating metastasis.
a Down-regulated pathways upon ICAM1 knockdown in MDA-MB-231 cells, analyzed by RNA sequencing (top) and mass spectrometry analysis (bottom). b GSEA of the gene sets for histone deacetylase targets, H3K27ME3, and EZH2 targets enriched among the up-regulated genes in MDA-MB-231 ICAM1 knockdown cells in comparison to siRNA control, identified by RNA sequencing. c Immunoblots of ICAM1 and CDK6 in MDA-MB-231 cells transfected with control siRNAs (siCon) and siICAM1 for gene knockdown. N = 3 independent experiments. d, e Representative images (d) and mammosphere quantitation (e) of MDA-MB-231 cells transfected with siCon, siICAM1, and siCDK6 (n = 3 biological replicates, two-sided t test **P = 0.006; ***P = 0.0008. N = 3 independent experiments. The boxes range from the first to third quartile with x in a box indicating mean value and whisker lines extending to outliers (minimum and maximum). f–h Representative images (f) and quantitative data (g, h) of BLI signals of mice injectd with siCon, siICAM1, and siCDK6-transfected MDA-MB-231 cells via tail vein (n = 3 mice per cell group. g Data are presented as mean values ± SD, two-sided t test *P < 0.05; **P ≤ 0.01. N = 4 independent experiments. h The boxes range from the first to third quartile with x in a box indicating mean value and whisker lines extending to outliers (minimum and maximum). i, j Representative images (i) and counts (j) of proliferative MDA-MB-231 (50k cells/well) transfected with siCon, siICAM1, and siCDK6. Cell numbers were measured via hemocytometer counting 48 h after seeding (n = 4 biological replicates. two-sided t test *P = 0.04; **P = 0.01. N = 3 independent experiments. The boxes range from the first to third quartile with x in a box indicating mean value and whisker lines extending to outliers (minimum and maximum). k Pearson’s pairwise correlation plot of ICAM1 versus CDK6 expression in breast cancer patients (n = 4712), by BC Gene-Expression Miner v4.4. ICAM1 vs. CDK6 R = 0.40. ****P < 0.0001.

