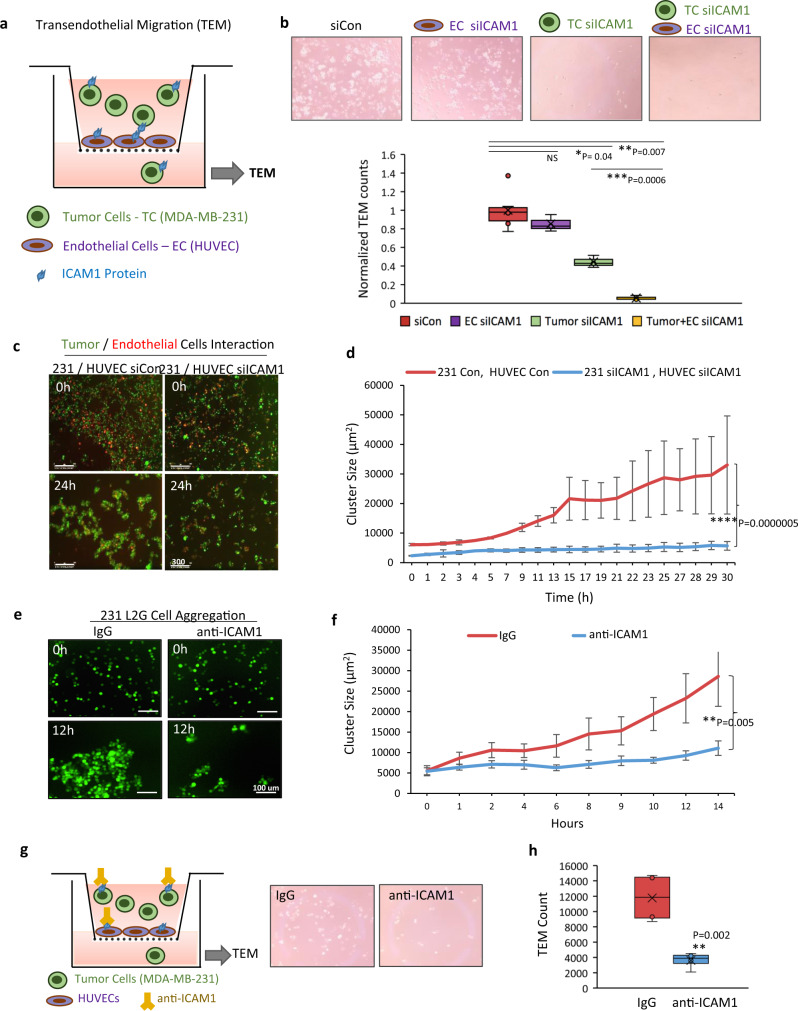
Fig. 4. ICAM1 mediates transendothelial migration of breast cancer cells.
a Diagram of TEM assay with HUVEC cell-coated transwell inserts and tumor cells seeded on the top. Tumor cells transmigrated to the bottom were measured 24 h after seeding. (MDA-MB-231 tumor cells; green, HUVEC; purple, and ICAM1 protein; blue). b Representative images (top) and quantitative analyses (bottom) of TNBC cells transmigrated to the bottom chamber, including four conditions (from left to right): (1) siRNA control tumor cells and HUVECs; (2) ICAM1 knockdown in endothelial cells (EC); (3) ICAM1 knockdown in tumor cells; (4) ICAM1 knockdown in both tumor cells and HUVECs (n = 3 biological replicates. Two-sided t test *P = 0.04; **P = 0.007; ***P = 0.0006. NS not significant. The boxes range from the first to third quartile with x in a box indicating mean value and whisker lines extending to outliers (minimum and maximum). c, d Time-lapse co-culture images at 0 and 24 h of incubation with TNBC cells (green) and endothelial cells (red) (c) and quantitative analyses of aggregates (d) following ICAM1 knockdown in both cell types (n = 8 biological replicates. Data are presented as mean values ± SD. Error bars represent SD values. Two-sided t test ****P = 0.0000005). e, f Representative images (e) and quantitative analyses (f) of TNBC cell cluster formation in the presence of IgG control or anti-ICAM1 neutralizing antibody (n = 10 biological replicates, Data are presented as mean values ± SEM. Error bars represent SE values. Two-sided t test **P = 0.005). g, h Diagram and representative images of TEM assay (g) and quantitative analysis (h) of breast tumor cells transmigrated to the bottom chamber in the presence of IgG control or anti-ICAM1 neutralizing antibody (n = 3 biological replicates. Two-sided t test **P = 0.002). (Diagram: MDA-MB-231 tumor cells; green, HUVEC; purple, ICAM1 protein; blue, and anti-ICAM1 antibody; yellow). The boxes range from the first to third quartile with x in a box indicating mean value and whisker lines extending to outliers (minimum and maximum).

