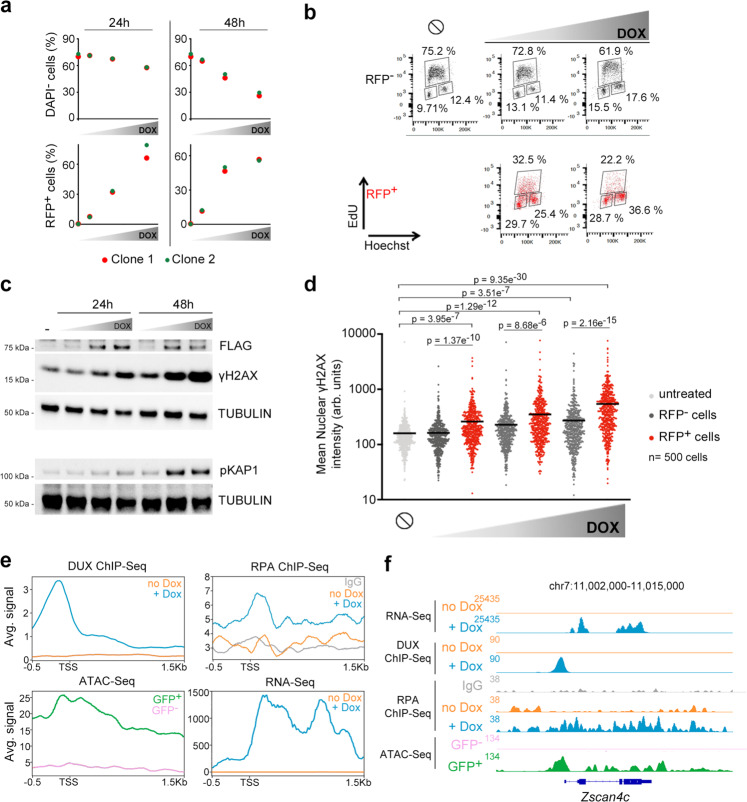
Fig. 1. Induction of 2C-like features in ESC correlated with DNA damage and cell death.
a Plots showing the percentage of alive (DAPI−) and RFP+ cells from LTR-RFP reporter ESCDUX treated with increasing doses of DOX (50, 150 and 300 ng/mL) for the indicated time points. Data was collected by flow cytometry. b Flow cytometry analysis of the cell cycle distribution in untreated or 150 and 300 ng/mL DOX-treated LTR-RFP reporter ESCDUX for 24 h. Percentages for each phase of the cell cycle are included. c Western blot analysis of the indicated proteins performed in ESCDUX treated with different doses of DOX (150, 300 and 600 ng/mL) for the indicated time points. Expression of DUX was monitored by its FLAG-tag. Tubulin levels are shown as a loading control. d High-throughput imaging (HTI) quantification of γH2AX in LTR-RFP reporter ESCDUX treated with different concentrations of DOX (150, 300 and 600 ng/mL) for 24 h. Center lines indicate mean values. ∅ = No treatment. n = 500; p-values are shown from two-tailed unpaired t-tests. In b and c, cells were split in RFP− or RFP+. In a–d, two independent experiments with similar results were performed with two different clones, but one representative experiment is shown. e Average read density plots (RPKM) showing RPA, DUX occupancy and RNAseq read counts from untreated or DOX-treated DUX expressing ESC (our data and ref. 5). ATACseq signal is shown from GFP– or GFP+ cells sorted DOX-treated LTR-GFP reporter ESCDUX5. Plots were generated using the 100 most upregulated genes upon DUX expression in ESC5. TSS = Transcription start site. f Genome browser tracks showing RPA, DUX occupancy, RNAseq read counts and ATACseq signal in the region surrounding Zscan4c.

