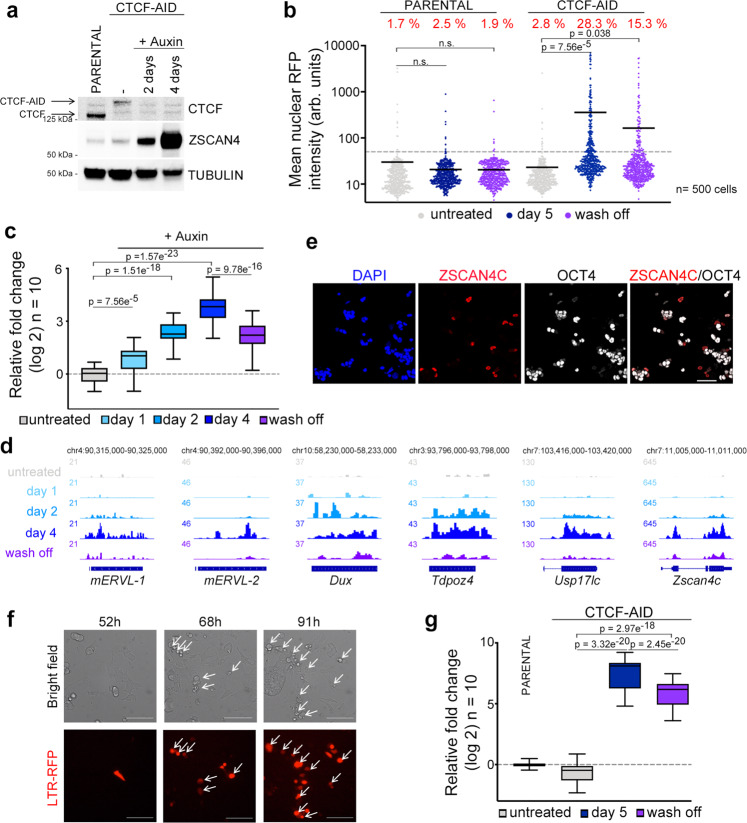
Fig. 3. Spontaneous 2C-like conversion in CTCF-depleted ESC.
a Western blot analysis performed in parental ESC and ESCCTCF-AID treated with auxin for the indicated times. Tubulin levels are shown as a loading control. b HTI quantification of RFP+ cells in untreated or auxin-treated for five days LTR-RFP reporter parental ESC and ESCCTCF-AID. RFP+ cells two days after a wash-off following three days of auxin treatment were also quantified. Center lines indicate mean values. Percentages of RFP+ cells above the threshold are indicated. n = 500; p-values are shown from two-tailed unpaired t-tests. n.s. = non-significant. c Box and whisker plot showing the relative fold change (log2) expression of ten 2C-associated genes/repeats (DUX, ZSCAN4, ZFP352, TCSTV3, SP110, TDPOZ1, DUB1, EIF1ad8, PRAMEL7 and MERVLs) in ESCCTCF-AID treated with auxin for the indicated times. Untreated and wash off ESCCTCF-AID were also included. Data was obtained from RNAseq datasets27. d Genome browser tracks showing RNAseq RPKM read count at the indicated genes in the same samples as in c. e Immunofluorescence analysis of ZSCAN4 and OCT4 in ESCCTCF-AID treated with auxin for 4 days. DAPI was used to visualize nuclei. Scale bar, 100 μm. f Representative bright field images (upper panels) from a time lapse experiment performed in auxin-treated LTR-RFP reporter ESCCTCF-AID. RFP+ cells are shown as they convert over time (lower panels). Time since the addition of auxin is indicated. White arrows indicate 2C-like converted cells undergoing cell death. Scale bars, 100 μm. g Box and whisker plot showing the relative fold change (log2) expression of ten 2C-associated genes (same as in c) in LTR-RFP reporter ESCCTCF-AID untreated or treated with auxin for four days and further incubated with auxin or washed-off for additional 18 h (a total of five days) and sorted based on RFP expression. GAPDH expression was used to normalize. For box plots (c, g), center line indicates the median, box extends from the 25th to 75th percentiles and whiskers show Min to Max values. p values are shown from two-tailed paired t-tests. In a, b, e–g, one representative experiment is shown but three (a, b) and two (e–g) independent experiments were performed.

