Figure 3.
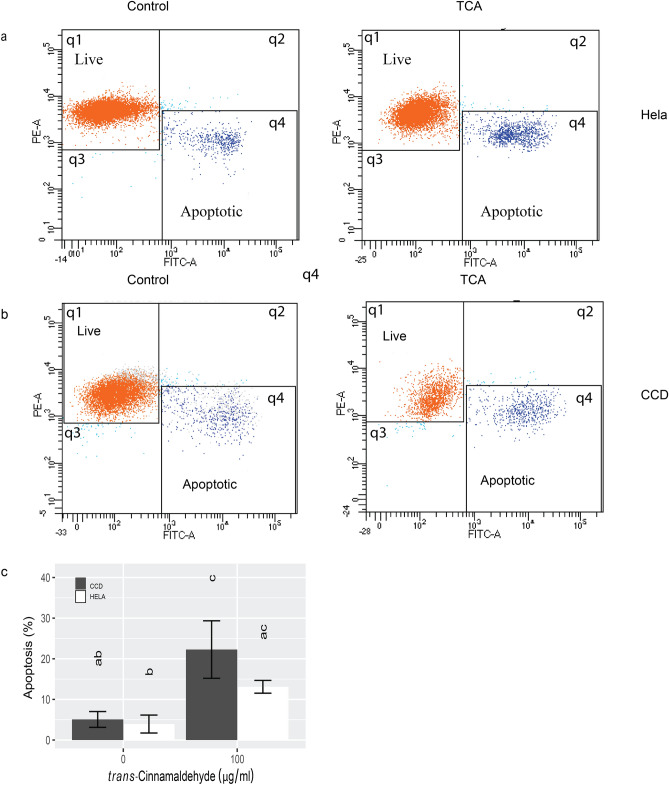
Flow cytometry analysis for apoptosis in HeLa (a) and CCD cells (b) after TCA (0 and 100 µg/ml) treatment for 4 h. In each scatterplot, live cells (red dots in q1) were stained positive for Mito tracker (red) and negative for Annexin V which indicated positive mitochondrial activity and apoptotic cells, respectively. Apoptotic cells (dark blue dots in q4) were Annexin V and Mito tracker positive. (c) The mean percentages of apoptotic HeLa and CCD cells before and after TCA treatment. While both cell types responded to TCA and no significant difference was found between the cell type, with CCD cells appearing to have an accelerated response.

