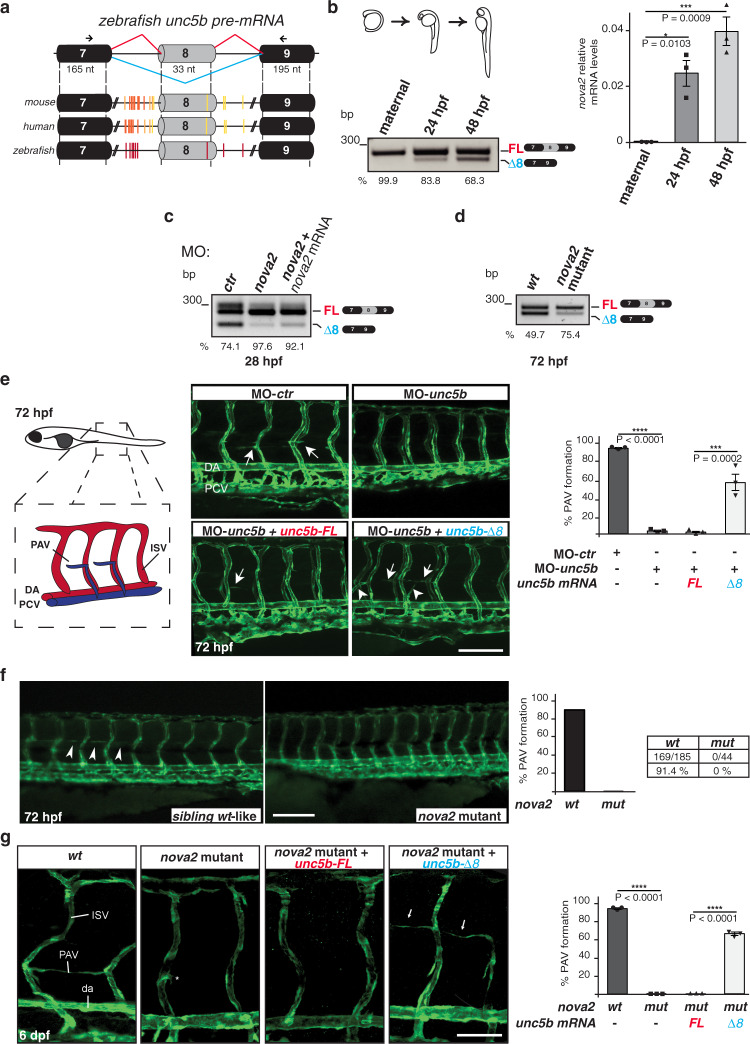
Fig. 3. Unc5b-Δ8 promotes PAV vessel formation in zebrafish.
a Schematic representation of mouse, human, and zebrafish unc5b genomic regions with the AS exon 8 in gray. Black boxes = constitutive exons; lines = introns. YCAY motifs identified with RBPmap tool are indicated as vertical bars. Arrows indicate primers for RT-PCR. b Splicing analysis of unc5b exon 8 and nova2 mRNA expression levels in zebrafish embryos at different developmental stages: maternal, 24 h post-fertilization (hpf), and 48 hpf. c RT-PCR with RNA extracted from zebrafish embryos (28 hpf) injected with a control morpholino (MO-ctr) or a morpholino against nova2 (MO-nova2). Altered AS was partially corrected by the co-injection of a morpholino-resistant nova2 mRNA (MO-nova2+nova2). n = 6. d Compared to the wild-type (wt) organism, nova2 mutants show a reduction of the unc5b-Δ8 transcript (72 hpf). The percentage of exon inclusion is indicated. n = 3. e Left: scheme of zebrafish vessels; PAV parachordal vessel, DA dorsal aorta, PCV posterior cardinal vein, ISV intersegmental vessel. Central: lateral views (fluorescence) of Tg(kdrl:GFP) la116 zebrafish embryos (72 hpf) injected with a control morpholino (MO-ctr) or with a morpholino against unc5b (MO-unc5b); unc5b morphants were also co-injected with morpholino-resistant zebrafish mRNAs encoding for unc5b AS isoforms (unc5b-FL or unc5b-Δ8). Right: quantification of embryos in which PAV is correctly formed (%). n = 3. Arrows indicate correctly forming PAV, whereas arrowheads indicate those unproperly forming. f Left: Lateral views (fluorescence) of 72 hpf wild-type (wt) and nova2 CRISPR mutant zebrafish embryos. Right: Quantification of PAV formation in 72 hpf wild-type (wt) and nova2 mutant (mut). N. of larvae with normal PAV out the total n. of larvae. Arrowheads indicate forming PAV. g Left: lateral views (fluorescence) of wt and nova2 mutant embryos (6 dpf) injected with mRNAs encoding for unc5b AS isoforms (unc5b-FL or unc5b-Δ8). Arrows indicate forming PAV. Right: quantification of embryos in which PAV is correctly formed (%). n = 3. n = biologically independent experiments. One-way ANOVA for multiple comparisons; Error bars indicate ±SEM. Exact P values are indicated: *P < 0.05; ***P < 0.001; ****P < 0.0001. Scale bars: 50 μm in e, 100 μm in f, 25 μm in g.

