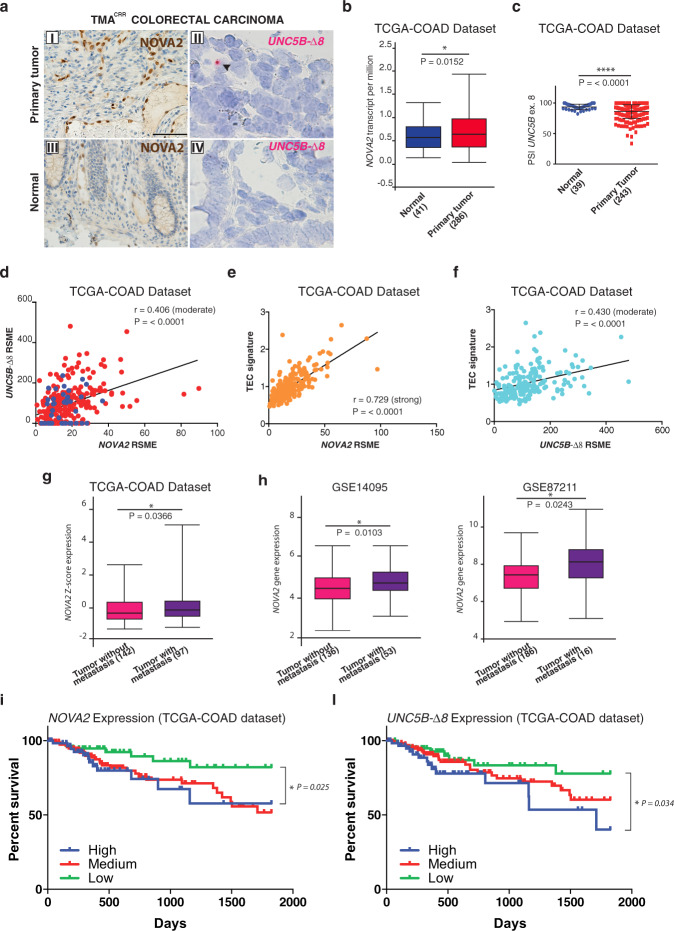
Fig. 5. NOVA2 and UNC5B-Δ8 expression levels in colon cancer patients.
a IHC of NOVA2 (I and III, scale bar: 60 μm) and ISH with the UNC5B-Δ8 probe (II and IV, scale bar: 30 μm) in colon primary tumors and normal adjacent tissues. Black arrowheads indicate UNC5B-Δ8 signal in ECs in tumor blood vessels. b RNA-seq data analysis of NOVA2 mRNA expression levels, c PSI (Percent Spliced-In) of UNC5B exon 8, and d correlation between NOVA2 and UNC5B-Δ8 expression in normal (blue) and colon adenocarcinoma (red) samples in the TCGA-COAD dataset. e NOVA2 and f UNC5B-Δ8 correlation with a colon tumor-specific angiogenetic signature (TEC). g NOVA2 mRNA Z-score expression levels in colon adenocarcinoma without (N0) or with metastasis (N1 or N2) annotated in the TCGA-COAD dataset. h NOVA2 mRNA expression levels in colon adenocarcinoma without or with metastasis (GSE14095 and GSE87211 datasets; http://hcmdb.i-sanger.com). i Kaplan–Meier plot of 5-years overall survival in colon adenocarcinoma patients classified according to NOVA2 or l UNC5B-Δ8 mRNA expression. Blue curve: high expression (1st quartile); red curve: moderate expression; green curve: low expression (3rd quartile). Log-ranked P-values are indicated. Boxplot represents upper quartile, median, lower quartile. Error bars indicate minimum and maximum. Two-tailed Log-ranked test (in b) or Two-tailed Student’s t-test (in c and g) and exact P values are indicated: *P < 0.05, ****P < 0.0001. P values in h, were calculated by HCMDB platform. For correlation analysis, linear regression (black line) and Pearson r coefficient with two-tailed P-value were also calculated.

