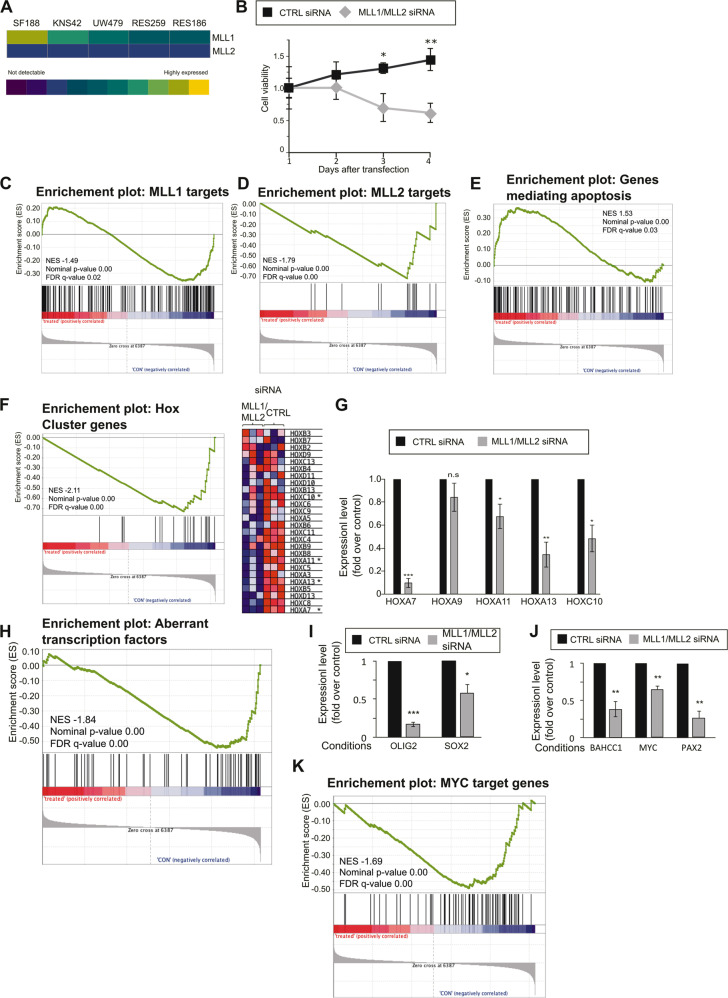
Fig. 1. MLL downregulation inhibits cell proliferation and decreases H3K4 methylation.
A Array data analysis derived from Bax et al. [14]. In the heat map, the relative expression levels of MLL1 and MLL2 are shown. B SF188 cells were seeded in six-well plates at a density of 0.4 × 10⁶ cells/well and transfected with 25 pmol ON-TARGETplus Control pool Non-Targeting pool (labeled C), or ON-TARGETplus SMART pool siRNA targeting MLL1 and MLL2 (labeled siRNA). Cell viability assays were performed on the indicated days. Data are mean ± STD; n = 3; ∗p < 0.05, ∗∗p < 0.01; student t-test. C GSEA showing significant negative enrichment of the WANG_MLL_TARGETS gene set after MLL1/MLL2 downregulation in SF188 cells. The gene set comprises genes that require MLL1 for H3K4me3 and expression in mouse embryonic fibroblast cells. D GSEA showing significant negative enrichment of the MLL2_TARGETS gene set for MLL1/MLL2 downregulation in SF188. The gene set comprises previously described MLL2 targets (see material and method). E GSEA showing significant negative enrichment of genes that mediate apoptosis by activation of caspases (MSigDB gene set: HALLMARK_APOPTOSIS) for MLL1/MLL2 downregulation in SF188 cells. F GSEA showing significant negative enrichment of Hox cluster genes for MLL1/MLL2 downregulation in SF188 cells. The gene set comprises all Hox cluster genes. The heatmap represents Hox cluster genes expression in the three independent experiments. Genes present in the core enrichment signature are highlighted in light green, genes marked with an asterisk were further analyzed by qPCR. G: qPCR analyses of selected HOX genes expression. Data are mean ± STD; n = 3; ∗p < 0.05, ∗∗p < 0.01; one-sample t-test. H GSEA showing significant negative enrichment of transcription factors with aberrant expression in glioblastoma as reported by Rheinbay et al. [20]. I and J qPCR analyses of selected transcription factors expression upon MLL1/MLL2 downregulation. Data are mean ± STD; n = 3; ∗p < 0.05, ∗∗p < 0.01, ∗∗∗p < 0.001; one-sample t-test. k GSEA showing downregulation of MYC targets genes set for MLL1/MLL2 downregulation in SF188 cells.

