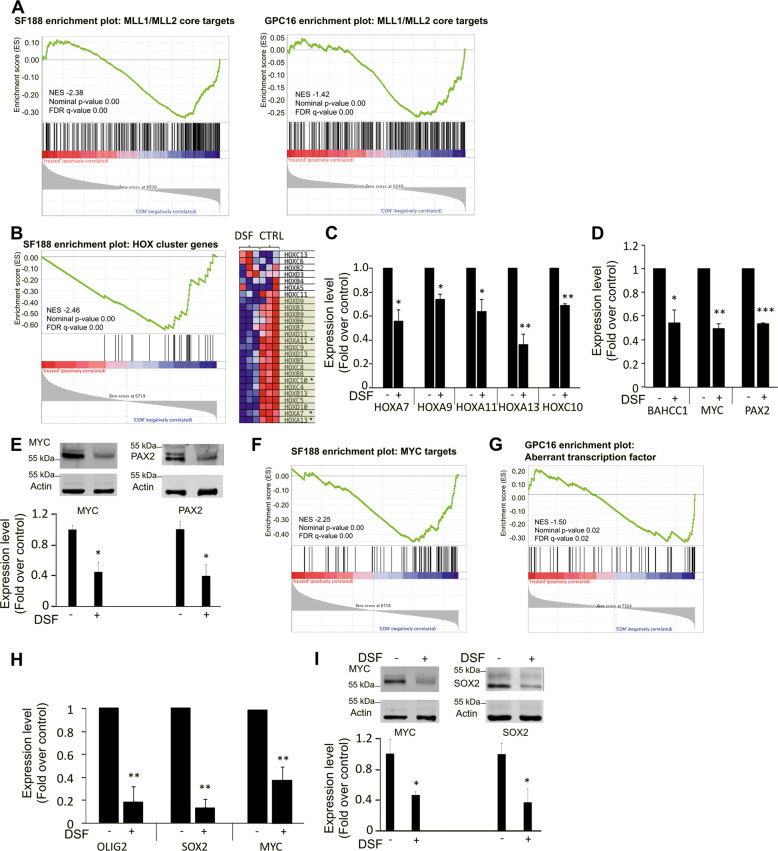
Fig. 6. Changes in SF188 and GPC16 gene expression following disulfiram treatment.
A and B GSEA showing downregulation of MLL1/MLL2 core genes set (genes downregulated upon MLL1/MLL2 downregulation) in disulfiram-treated SF188 and GPC16 cells. C GSEA showing downregulation of HOX cluster genes set (gene set including all 39 human Hox cluster genes) in disulfiram-treated SF188 cells. The heatmap is part of the GSEA. It represents Hox cluster genes expression in disulfiram-treated (DSF) and untreated cells (CTRL) with three replicates each. Genes present in the core enrichment signature are highlighted in green, genes marked with an asterisk were further analyzed. C qPCR analyses of HOX genes expression in disulfiram-treated SF188 cells. Data are mean ± STD; n = 3; ∗p < 0.05, ∗∗p < 0.01; one-sample t-test. D qPCR analyses of transcription factors expression upon disulfiram treatment. Data are mean ± STD; n = 3; ∗p < 0.05, ∗∗p < 0.01, ∗∗∗p < 0.001; one-sample t-test. E Western blot analysis of MYC and PAX2 expression level upon disulfiram treatment. Data are mean ± STD; n = 3; ∗p < 0.05, t-test. F GSEA showing downregulation of MYC targets genes set (genes upregulated upon MYC expression) in disulfiram-treated SF188 cells (MSigDB gene set: SCHUHMACHER_MYC_TARGETS_UP). G GSEA showing downregulation of aberrant transcription factor set (75 transcription factors with aberrant expression in glioblastoma as reported by Rheinbay et al.) in disulfiram-treated GPC16 cells. H qPCR analyses of OLIG2, SOX2, and MYC expression in disulfiram-treated GPC16 cells. Data are mean ± STD; n = 3; ∗∗p < 0.01; one-sample t-test. I Western blot analysis of SOX2 and MYC expression level upon disulfiram treatment. Data are mean ± STD; n = 3; ∗p < 0.05, t-test.

