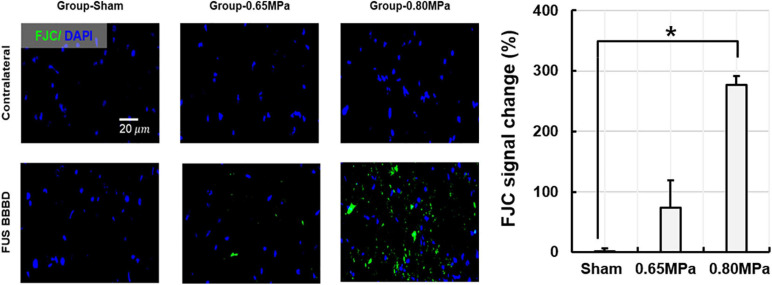
FIGURE 9.
Representative Fluoro-Jade C (FJC) histology and its quantification at 48 h after the FUS–BBBD. The samples of group-0.65 MPa show weakly expressed FJC, while those of group-0.80 MPa show notable FJC expression, indicating neuron degeneration. Green and blue fluorescence indicate the FJC expression and the DAPI, respectively. Scale bar of FJC: 20 μm. *p < 0.05.

