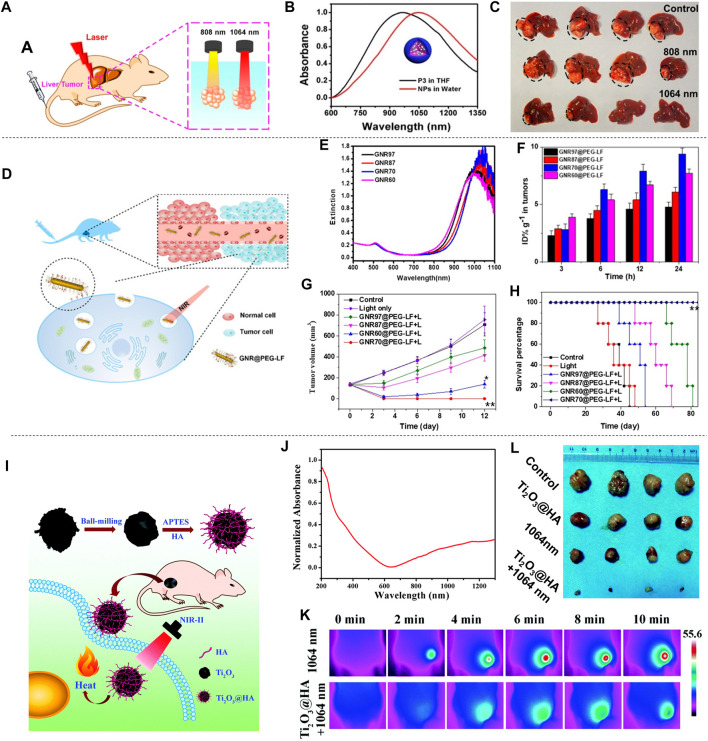
FIGURE 10.
Photothermal treatment of liver cancer. (A) Schematic diagram of PTT of liver cancer in situ with SPNs under 808 or 1,064 nm laser irradiation. (B) Absorption spectra of four semiconducting polymers (P1-P4) in THF. (C) Photograph of liver of tumor-bearing mice resected 17 days after treatment. Black circles indicate tumors in the liver (reproduced from (Sun et al., 2019) with permission from American Chemical Society). (D) Schematic diagram of the distribution of GNR@PEG-LF in vivo and its use in photothermal treatment of cancer. (E) UV-vis-NIR spectra of GNRs@CTAB with different widths and lengths. (F) Histogram of the concentration of GNR@PEG-LF in tumors. (G) Tumor growth inhibition curves in mice injected with different GNRs and irradiated with 980 nm light (0.5 W cm−2) for 3 min. (H) The Kaplan-Meier graph shows the percentage of animals surviving the study over time (reproduced from (Yang et al., 2020) with permission from Academic Press Inc.). (I) Schematic diagram of the preparation of Ti2O3@HA and its PTT for superficial tumors. (J) Absorption spectrum of Ti2O3@HA nanoparticles in PBS. (K) Infrared thermal image of HepG-2 tumor-bearing mice injected with PBS or Ti2O3@HA nanoparticles and irradiated with a 1064 nm laser (5 min at a power density of 1.0 W cm−2). (L) Tumor images of each group after 14 days of different treatments (reproduced from (Zeng et al., 2018) with permission from Royal Society of Chemistry).

