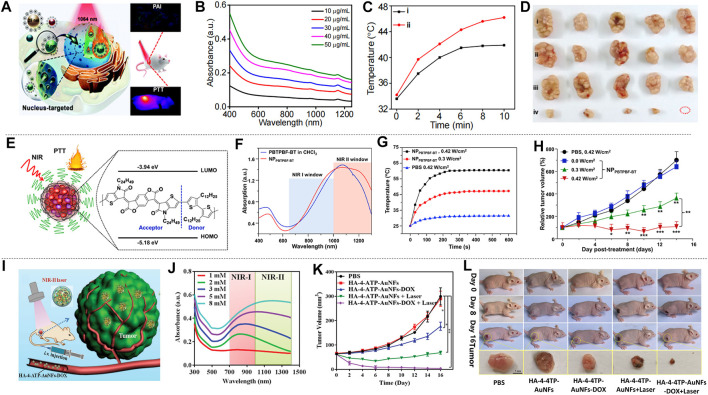
FIGURE 8.
Treatment effect of mice with MCF-7 and MDA-MB-231 breast cancer cells. (A) Graph of nucleus-targeting ultrasmall CS-RuO2 NPs and for PTT under NIR-Ⅱ laser. (B) UV-vis-NIR absorption spectra of ultrasmall CS-RuO2 NPs at varying concentrations. (C) Temperature of tumor in live mice in two groups: 1) PBS + NIR-Ⅱ, 2) ultrasmall CS-RuO2 NPs + laser. (D) Representative digital photos of tumor under four groups treatment: 1) PBS, 2) PBS + laser, 3) ultrasmall CS-RuO2 NPs, 4) ultrasmall CS-RuO2 NPs + laser (reproduced from (Liu et al., 2020) with permission from Royal Society of Chemistry). (E) Schematic illustration of the preparation of NPPBTPBF-BT for PTT. (F) Absorption spectra of nanoparticle NPPBTPBF-BT and PBTPBF-BT in CHCl3. (G) Temperature change line during the three groups treatment. (H) The MDA-MB-231 tumor growth curves of different groups of mice (reproduced from (Cao et al., 2018) with permission from Elsevier BV). (I) HA-4-ATP-AuNFs-DOX for PTT. (J) UV–vis–NIR spectra of AuNFs with various HAuCl4 concentration. (K) The tumor volume changes of five groups’ treatment. (L) Photos of mice in five groups during three treatment period and tumor photo after treatment (reproduced from (Wang et al., 2020) with permission from Wiley-VCH Verlag).

