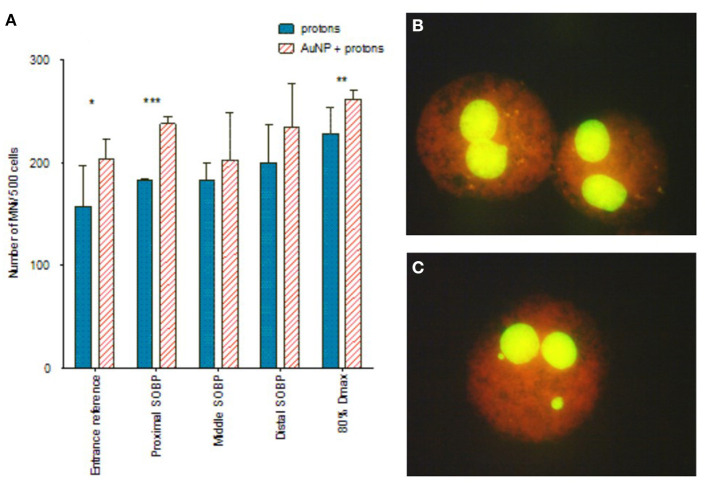
Figure 5.
(A) The effect of protons and AuNPs on the MNi expression of CHO-K1 cells. Where (*) denotes p < 0.05, (**) = p < 0.01 and (***) = p < 0.001. (B) Binucleated cells without MNi (proton alone). (C) Binucleated cells containing MNi (protons + 50nm AuNPs). The plotted values in the graph represent the average number of MNi/500 BN cells and the respective standard deviation of three biological repeats. Created with Biorender.com.

