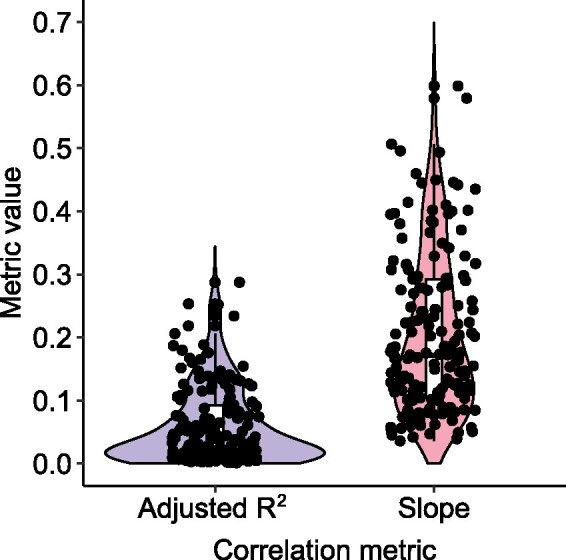
Fig. 1.

The correlation between gene mobility and metagenomic sequencing coverage is positive but widely variable. The boxplots and violin plots show the distributions of adjusted R2 values (blue) and slopes (red) across samples (individuals from Fiji) for the correlation between coverage (average depth per site) and gene mobility. The black dots represent the 167 samples (out of 175 tested) in which the correlation is significant (t-test, FDR-adjusted P < 0.05). Examples of this correlation in four randomly selected samples are shown in supplementary figure S2, Supplementary Material online.
