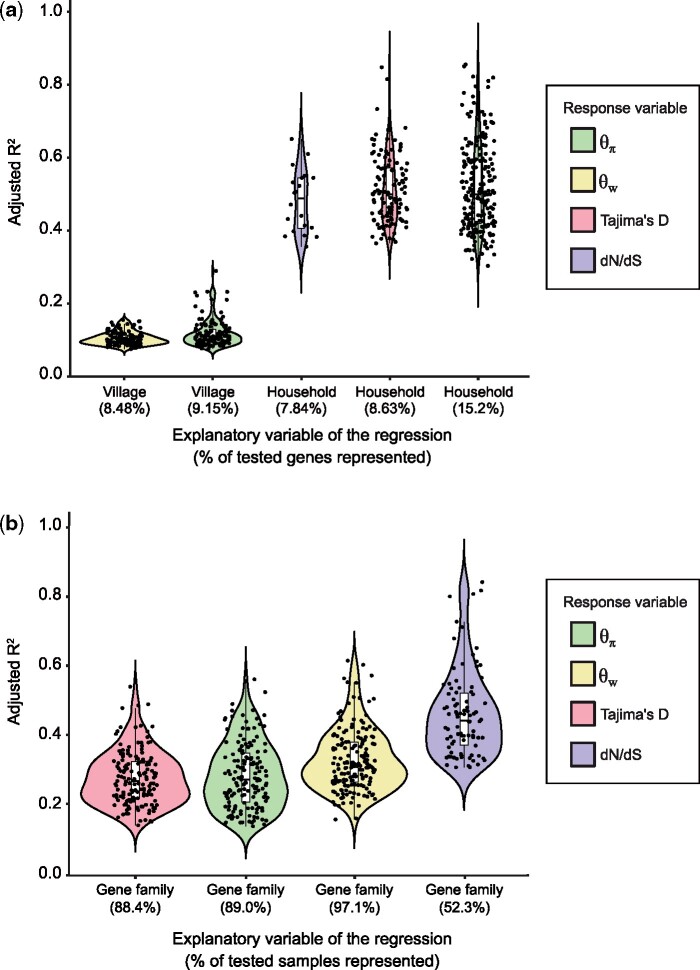
Fig. 3.
Gene function explains more variation in mobile gene sequence evolution than human host attributes. (a) Adjusted R2 values for the categorical regressions between population genetic metrics (color-coded) and human host attributes. We only considered genes with at least 10X coverage in a sample, and we also required that mobile gene should have less than 30% missing values across samples, for a total of 1,333 genes included in this analysis. The five strongest and most prevalent correlations between population genetics metrics and human host factors are shown (FDR-adjusted P < 0.05). Not shown are village significantly correlated with Tajima’s D (0.75%) and dN/dS (0%), and household significantly correlated with (0.38%). Human host age and sex did not show any significant effects on mobile gene sequence evolution. Each black point represents a mobile gene for which the categorical regression is significant. The percentage of significant genes out of the total number of genes tested is indicated in parentheses along the x-axis. For dN/dS, the sample size was reduced to n = 255 genes because an additional filter requiring mutations to be seen in the least five metagenomic reads was applied before computing dN/dS, which can other be sensitive to sequencing errors (Materials and Methods). (b) Adjusted R2 values of the categorical regressions between a population genetic metric and the gene family. Each black point represents a sample for which the categorical regression is significant. The percentage of significant samples out of the total number of samples tested is indicated in parenthesis along the x-axis. Only 172 out of 175 samples for which metadata were available are included in this analysis. We only considered genes with at least 10X coverage in a sample. We only included genes with a gene family annotation and required that each gene family be represented by at least two genes. Finally, we only included genes present in 70% or more of the samples (less than 30% missing values), for a total of 512 genes.

